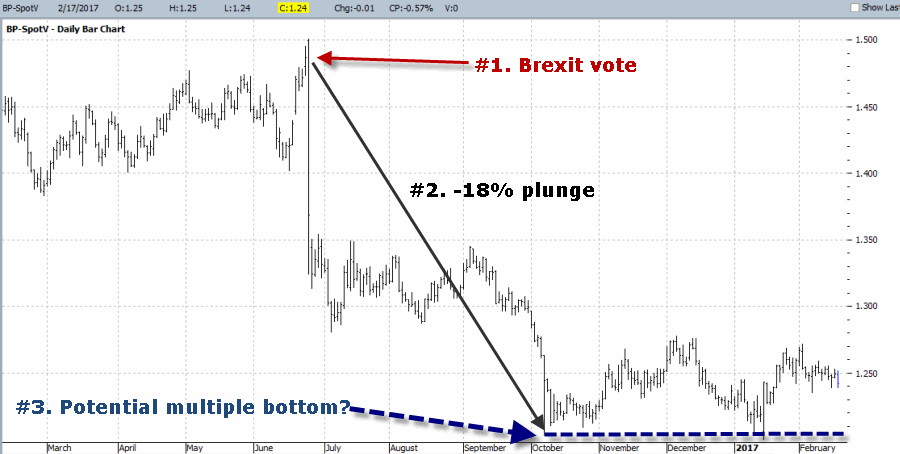
I am generally a “trend-follower” by nature, I have to admit that I am a bit of a sucker for a good contrarian play (See here , here and here). On a purely subjective basis, what could be more of a contrarian play than to be bullish on the British Pound? The Brexit vote back in June 2016 triggered a -18% plunge in the pound in less than four months. Since that time the pound has been bouncing along sideways and (again from a subjective perspective) could be forming a multiple bottom.
Figure 1 – British Pound futures (Courtesy ProfitSource by HUBB)
From a contrarian point of view I find myself with a hankering’ to speculate on the long side in the pound. But I am holding off for now. Why? Take a look at Figure 2, which displays the annual seasonal trend for British Pound futures going back to 1977.
Figure 2 – Annual Seasonal Trend for British Pound futures (1977-2016)
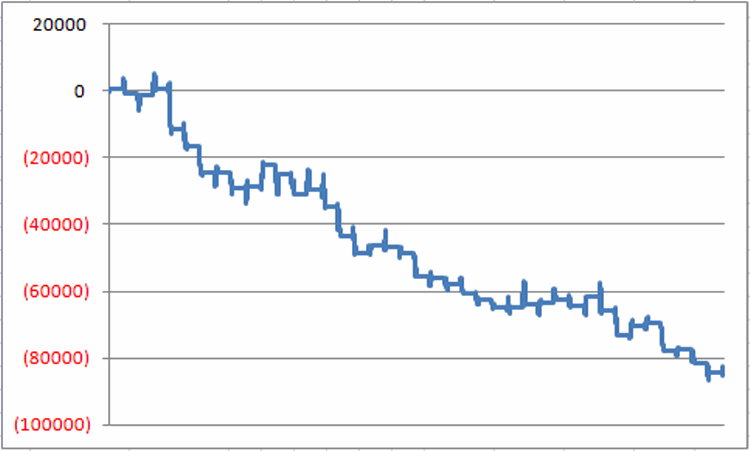
As you can see, the period between roughly now and March Trading Day of the Month (TDM) #8 is arguably the weakest time of year. Figure 3 displays the results achieved by holding a long position in British Pound futures from the close on December 31st the prior year through the close on March TDM #8 every year since 1978.
Figure 3 – Cumulative $ Gain/Loss for British Pound futures Dec 31st through Mar TDM 8 (1978-2016)
Figure 4 displays the year-by-year results
Figure 4 – Year-by-Year $ Gain/Loss for British Pound futures Dec 31st through Mar TDM #8 (1978-2016)
For the record:
- # times BP (LON:BP) showed a gain = 13 (33%)
- # times BP showed a loss = 26 times (67%)
- Average $ gain = +$1,604
- Average $ loss = (-$4,075)
On the other hand, Figure 5 displays the results achieved by holding a long position in British Pound futures between March TDM #8 and May TDM #4.
Figure 5 – Cumulative $ Gain/Loss for British Pound futures Mar TDM #8 through May TDM #4 (1978-2016)
For the record, between Mar TDM #8 and May TDM #4:
- # times BP showed a gain = 27 (68%)
- # times BP showed a loss = 13 times (32%)
- Average $ gain = +$3,513
- Average $ loss = (-$2,601)
Summary
For the record, the Pound has witnessed a decline 70% of the time between Feb TDM #13 (i.e., Feb 17, 2017) and Mar TDM #8. This also means that 30% of the time this period has seen the Pound advance. So there is no reason to assume that the Pound “is certain” to decline in the month ahead.
Still, while no market follows a set seasonal trend every year, the results displayed in Figures 2 through 5 suggest that for those with a hankering to speculate on the long side, waiting until after Mar TDM 8 to enter a long position in the Pound might be a good idea.
For traders not interested in futures, the ETF FXB allows traders to buy and hold the British Pound just as they would shares of stock.
In the meantime, if you need to find me, I’ll be over in the corner fighting the urge to be a wise guy.


