
ITT Inc. (NYSE:ITT) reported second-quarter 2017 results, with adjusted earnings of 65 cents per share beating the Zacks Consensus Estimate of 63 cents. Strong productivity and restructuring benefits led to better-than-expected earnings. However, the bottom line came in 3% lower than the year-ago tally of 67 cents.
Higher environmental costs along with unfavorable foreign exchange, more than offset favorable impacts of improved efficiency, a lower tax rate and interest expense.
Inside the Headlines
The company’s second-quarter revenues came in at $630.9, up 0.8% on a year-over-year basis. The figure also surpassed the Zacks Consensus Estimate of $627 million.
Organic revenues declined 2% year over year due to lower industrial and global oil and gas pump project activity, which was somewhat mitigated by growth in automotive market.
Adjusted operating income for the reported quarter was $88.3 million compared with $92.2 million in the second quarter of 2016. The decrease in adjusted operating income was attributable to a rise in commodity costs, unfavorable foreign exchange and a rise in strategic investments.
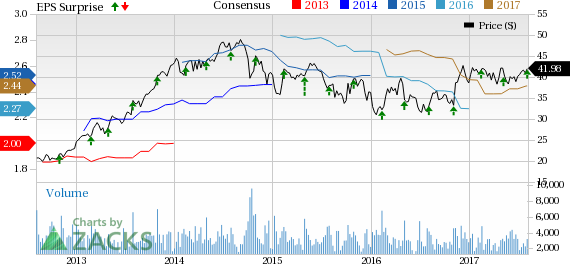
ITT Inc. Price, Consensus and EPS Surprise
Segment Performance
Total revenue and organic revenue at the Industrial Process declined 10% year over year to $192 million. The decline was primarily attributable a lesser number of oil and gas projects in North America, Asia and Latin America along with declines in baseline oil and gas pumps.
Revenues at the Connect and Control Technologies segment declined 3% year over year to $150 million. In addition, organic revenues fell 2% on a year-over-year basis. The decrease was primarily due to a decline in demand in commercial aerospace and restrictions on sales of military-specification connectors.
Motion Technologies’ revenues continued the strong momentum and climbed 12% year over year to $290 million. Additionally, organic revenues recorded an increase of 5%. Significant share gains and market growth in automotive brake pads in Europe and China and strong sealing solutions at Wolverine proved favorable to the top-line improvement.
Balance Sheet
Cash and cash equivalents totaled $355.3 million as of Jun 30, 2017 compared with $460.7 million on Dec 31, 2016. For the six months ended June 30, 2017, cash flow from operating activities totaled $92.7 million and capital expenditures were $53.3 million. At the end of the quarter, the company had 88 million shares outstanding.
2017 Guidance
For full-year 2017, ITT raised its previously announced revenue guidance of a decline of around 2% or increase up to 2% to the range of 0% to 2%, due to the favorable impact of foreign exchange. Adjusted earnings are now projected to be in the band of $2.40–$2.50 per share, up from the previous estimate of $2.28–$2.48.
Our Take
ITT’s focus on business streamlining, cost controls and efficiency continues to prove beneficial to its financial performance. The integration of its Interconnect Solutions and Control Technologies businesses into the Connect and Control Technologies segment will help enhance focus on target markets, streamline operations and leverage shared infrastructure and end markets. Its simplified operational framework will help unlock growth opportunities, as well as drive long-term growth in the global aerospace and industrial markets.
However, the company faces risks from uncertainty in the global macro-economic environment, especially weakness in industrial markets. Also, pricing pressure on large projects and lower petrochemical and mining project activity are anticipated to aggravate the decline in petrochemical business in North America and China.
The company currently has a Zacks Rank #3 (Hold). Some other stocks sharing the same space include:
Crane Company (NYSE:CR) , which delivered an average positive earnings surprise of 3.97% in the last four quarters. It has Zacks Rank #3. You can see the complete list of today’s Zacks #1 Rank stocks here.
Honeywell International Inc. (NYSE:HON) , with a Zacks Rank #2 (Buy). It delivered an average positive earnings surprise of 1.99% in the last four quarters.
3M Company (NYSE:MMM) , with a Zacks Rank #3, which came up with an average positive earnings surprise of 1.24% in the last four quarters.
5 Trades Could Profit "Big-League" from Trump Policies
If the stocks above spark your interest, wait until you look into companies primed to make substantial gains from Washington's changing course.
Today Zacks reveals 5 tickers that could benefit from new trends like streamlined drug approvals, tariffs, lower taxes, higher interest rates, and spending surges in defense and infrastructure. See these buy recommendations now >>
3M Company (MMM): Free Stock Analysis Report
ITT Inc. (ITT): Free Stock Analysis Report
Honeywell International Inc. (HON): Free Stock Analysis Report
Crane Company (CR): Free Stock Analysis Report
Original post
Zacks Investment Research