Whenever one hears the words precious metals, gold and silver spring to mind. But this world is much richer, and precious metals don’t end with the yellow or white metal. The less well known cousins, platinum and palladium, can and do send valuable signals too. Before we examine silver, let’s take a look at something interesting in palladium.

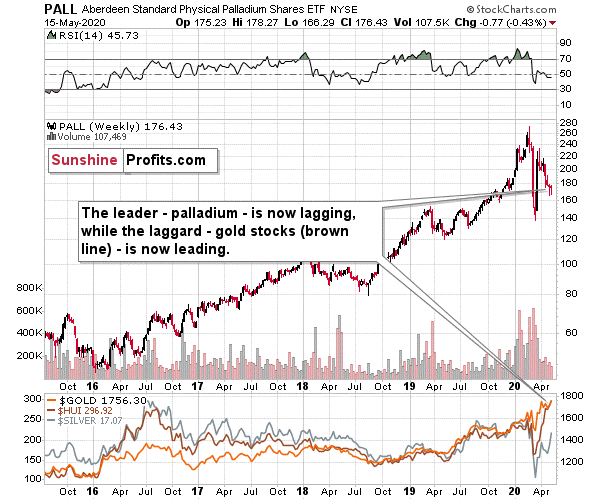
The interesting detail is palladium’s weakness. This precious metal was the one that soared most profoundly in the past few years and while it recovered some of its 2020 declines recently, it appears to be back in the bearish mode as its unable to keep gained ground, even despite the move higher in the general stock market.
The previous leader is now definitely lagging. And you know what was leading? The previous laggard – gold stocks.
And you know what is leading now? Silver – as it usually does in the final part of the upswing. The HUI Index is marked with brown in the bottom part of the chart. When leaders are lagging, and laggards are leading, one should recognize that the market is topping – and that’s the key take-away from the palladium and platinum analysis right now.
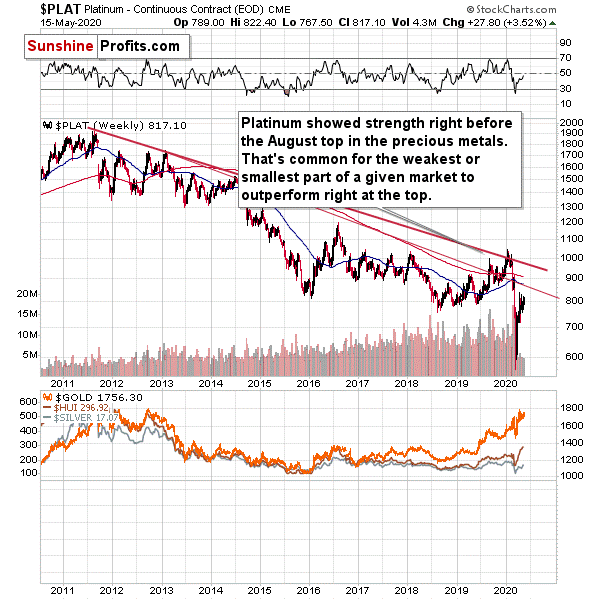
Palladium was the leader and platinum was actually one of the laggards. Palladium was down by 0.43 last week. And what did platinum do?

Platinum rallied by 3.52% last week.
The big rally in platinum-to-palladium ratio is yet another sign from the relative valuations analysis pointing to a nearby top in the precious metals sector.
Having said that, let’s take a look at silver’s forecast. In case of the white metal, its ratio to gold might be more important at this time than price itself.


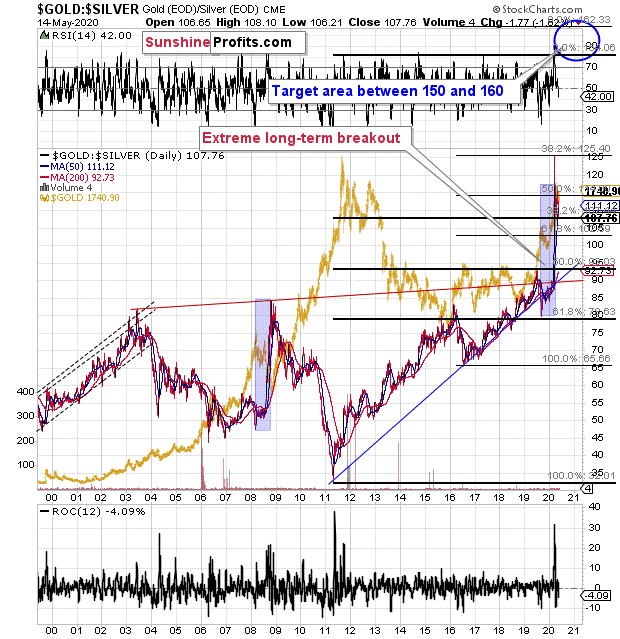
The silver futures are trading at $17.73, and gold futures are trading at $1,773, which means that in case of the futures market, the gold-to-silver ratio has just moved to the 100 level.
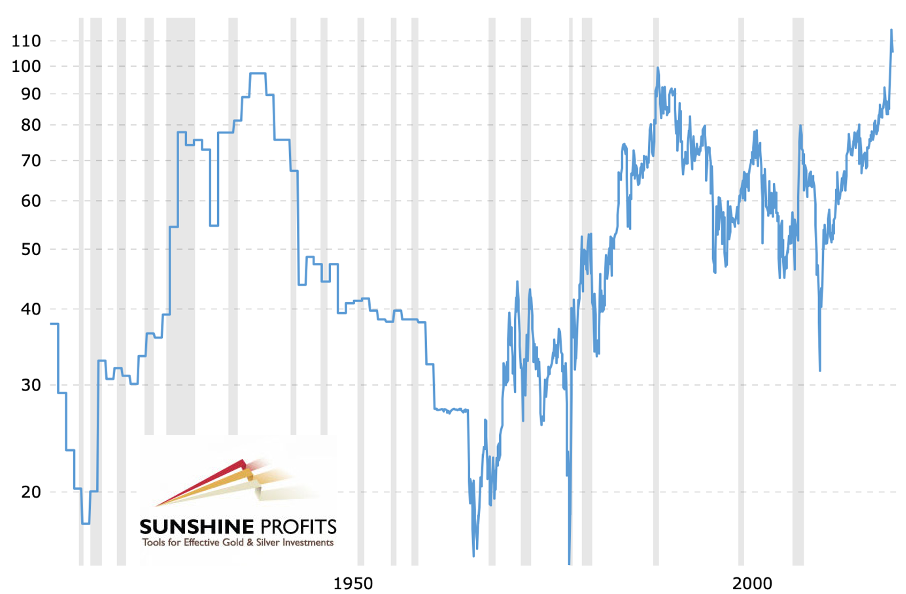
Earlier this year, the gold-to-silver ratio had broken above the very long-term and critical resistance of 100. Is it really that surprising that silver is verifying the breakout by moving back to the previously broken level? It’s not.
The key ratio for the precious metals market has just moved back to the previously broken resistance level and it’s verifying it as support. This is relatively normal that after a breakout, the price or ratio moves to the previously broken level.
Yes, on a short-term basis, and looking at silver chart alone, the breakout above the April highs and a quick move to the early-March highs was a clearly bullish phenomenon. However, this ignores the fact that silver is known for its fake-outs (fake breakouts) and that looking at its relative performance to gold has been more useful (and profitable) than looking at its individual technical developments, especially if they were not confirmed by analogous moves in gold.
Consequently, we view the current action in silver as bearish, not bullish, especially since the gold-to-silver ratio moved back to the very strong support level (100), which likely means that silver’s strength relative to gold is over, at least for some time.
