This article was first published on Sat Jun 22 for members of ElliottWaveTrader.net: With the break out we experienced this past week in GDX (NYSE:GDX) and GLD (NYSE:GLD), it has certainly placed a bullish spin on the complex. And, while it was a very difficult 3-year wait, which has likely chased out many an investor due to frustration, the market looks like it will reward those with patience.
Yet, I am still hearing many of the same points of skepticism, despite a very strong showing in the complex over the past week. So, I would like to reiterate what I said last week as I prepared you for a potential break out:
As gold approached its highs of the past 3 years during this week, I am now hearing about how the RSI is hitting overbought levels, how the COT is suggestively bearish due to the commercial’s short positions, etc. But, very few understand these points within the appropriate context.
You see, if the market is indeed still within a bearish posture, then overbought indicators are indicative of the market preparing to turn down again. And, if the market had rallied in a 3-wave fashion, then I would clearly be viewing this overbought indication as significant.
However, when the market turns towards its bullish inclinations, as it has potentially done with a 5-wave rally off the May lows, simply reaching a level in an indicator which has been viewed as an “overbought” reading is not bearish. Rather, these indicators will embed during a strong bullish move (most specifically a 3rd wave). This often fools everyone who is reading the indicator in the same way during a bullish trend as they do within a bearish trend. The same applies to the COT. We have seen many instances where the market has entered very long periods of extreme bullish action against the positioning of the commercial traders. So, again, I would not view this as dispositive of the nature of the market.
Rather, the one focus which is the common denominator of truth in the market is price. And, as I said this past week, once GLD breaks out over 127.25, we have to be on high alert that a 3rd wave parabolic rally can take hold at any time, similar to what was seen in early 2016.
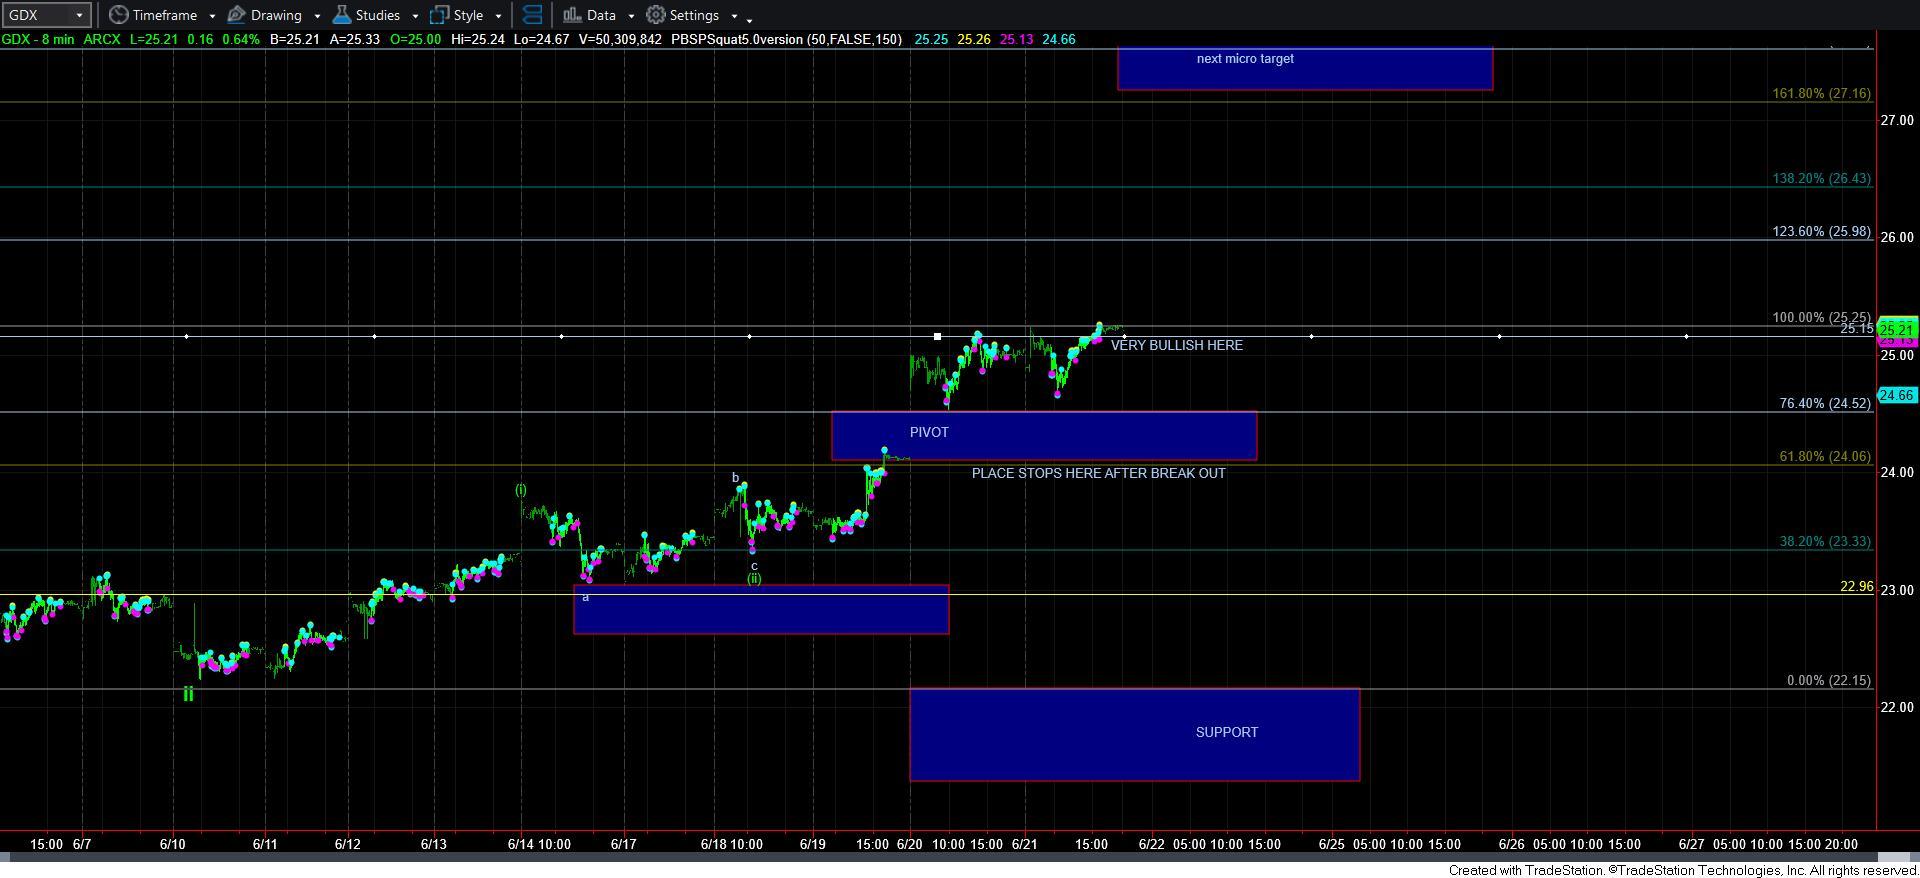
During the week, the GLD and GDX both gapped up over their relevant pivot boxes, and consolidated. At this point in time, as long as they remain over their pivot boxes, I will be looking higher. Moreover, I will continue to move those supports higher as price continues higher.
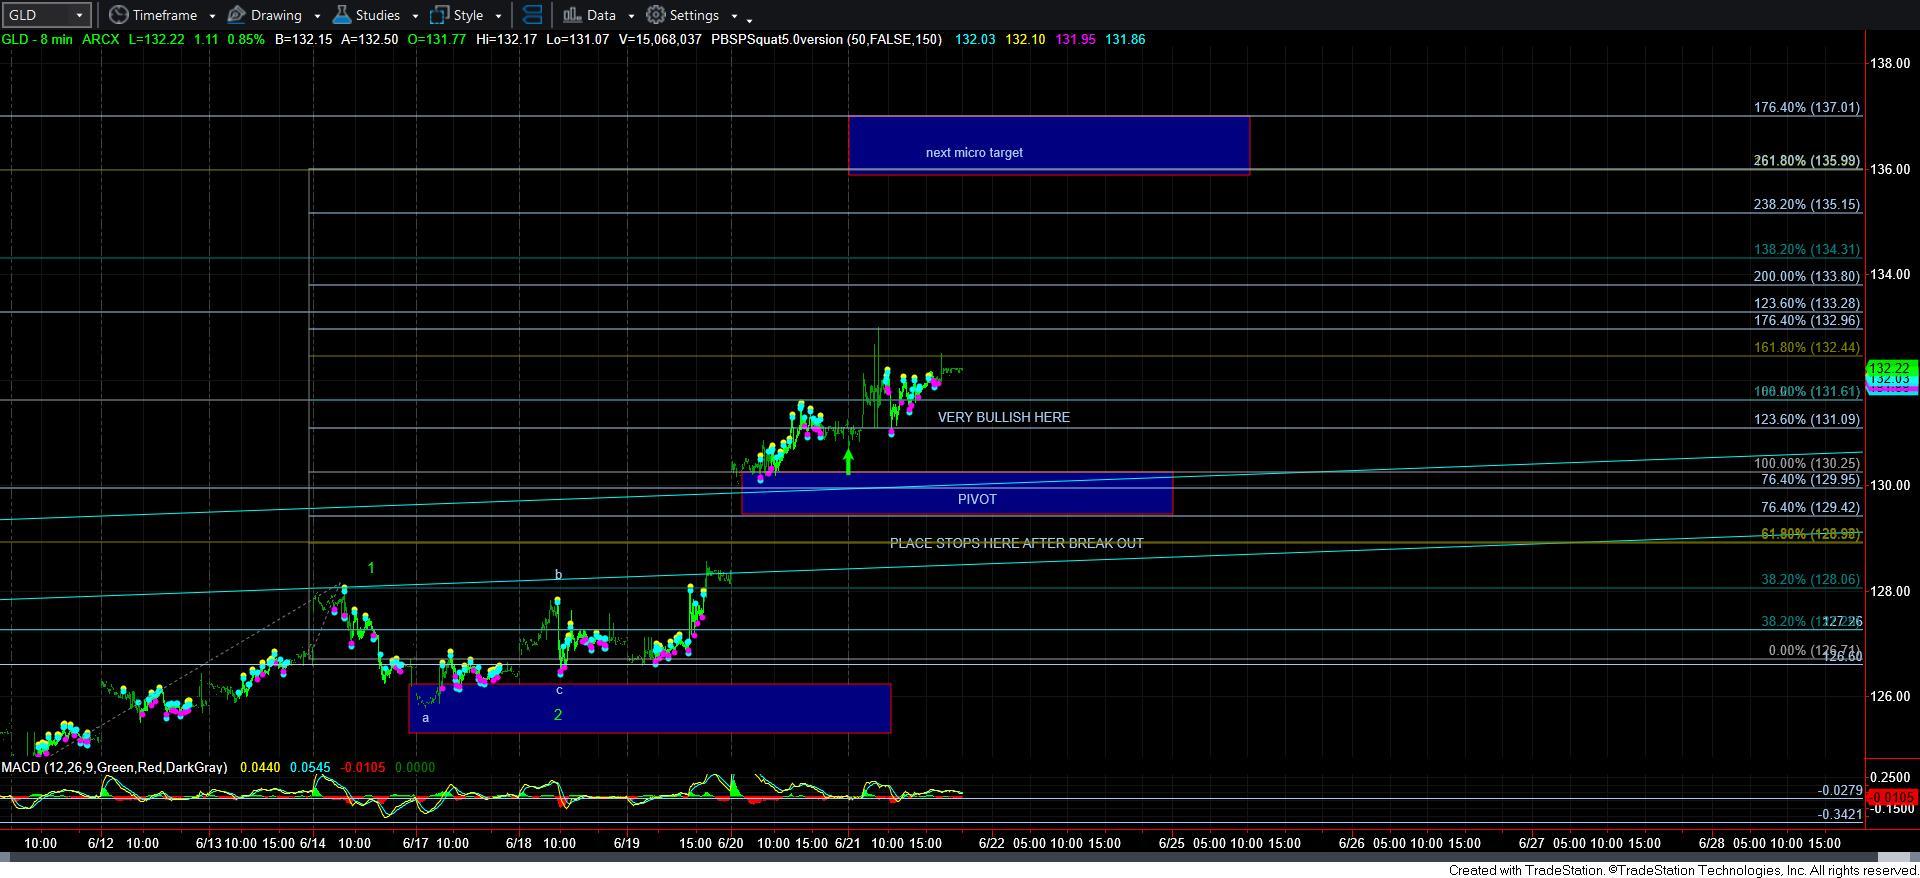
But, I want to make something very clear. The market is now set up in a very bullish posture. While my alternative count can allow for another pullback in the coming weeks, that would still be within a very bullish larger degree posture. So, the pivots that I am outlining on the smaller time frame charts are ONLY for those who are trading this market more aggressively in the smaller time frames and using leverage to do so. Therefore, those stop points are only for leveraged products. In my humble opinion, you only use leveraged products during the heart of a 3rd wave as that is when they are most beneficial and profitable. If the market should break down below those pivots then it opens the door to another pullback, which means we are not yet in the heart of the 3rd wave. But, again, that is only my alternative perspective at this time.
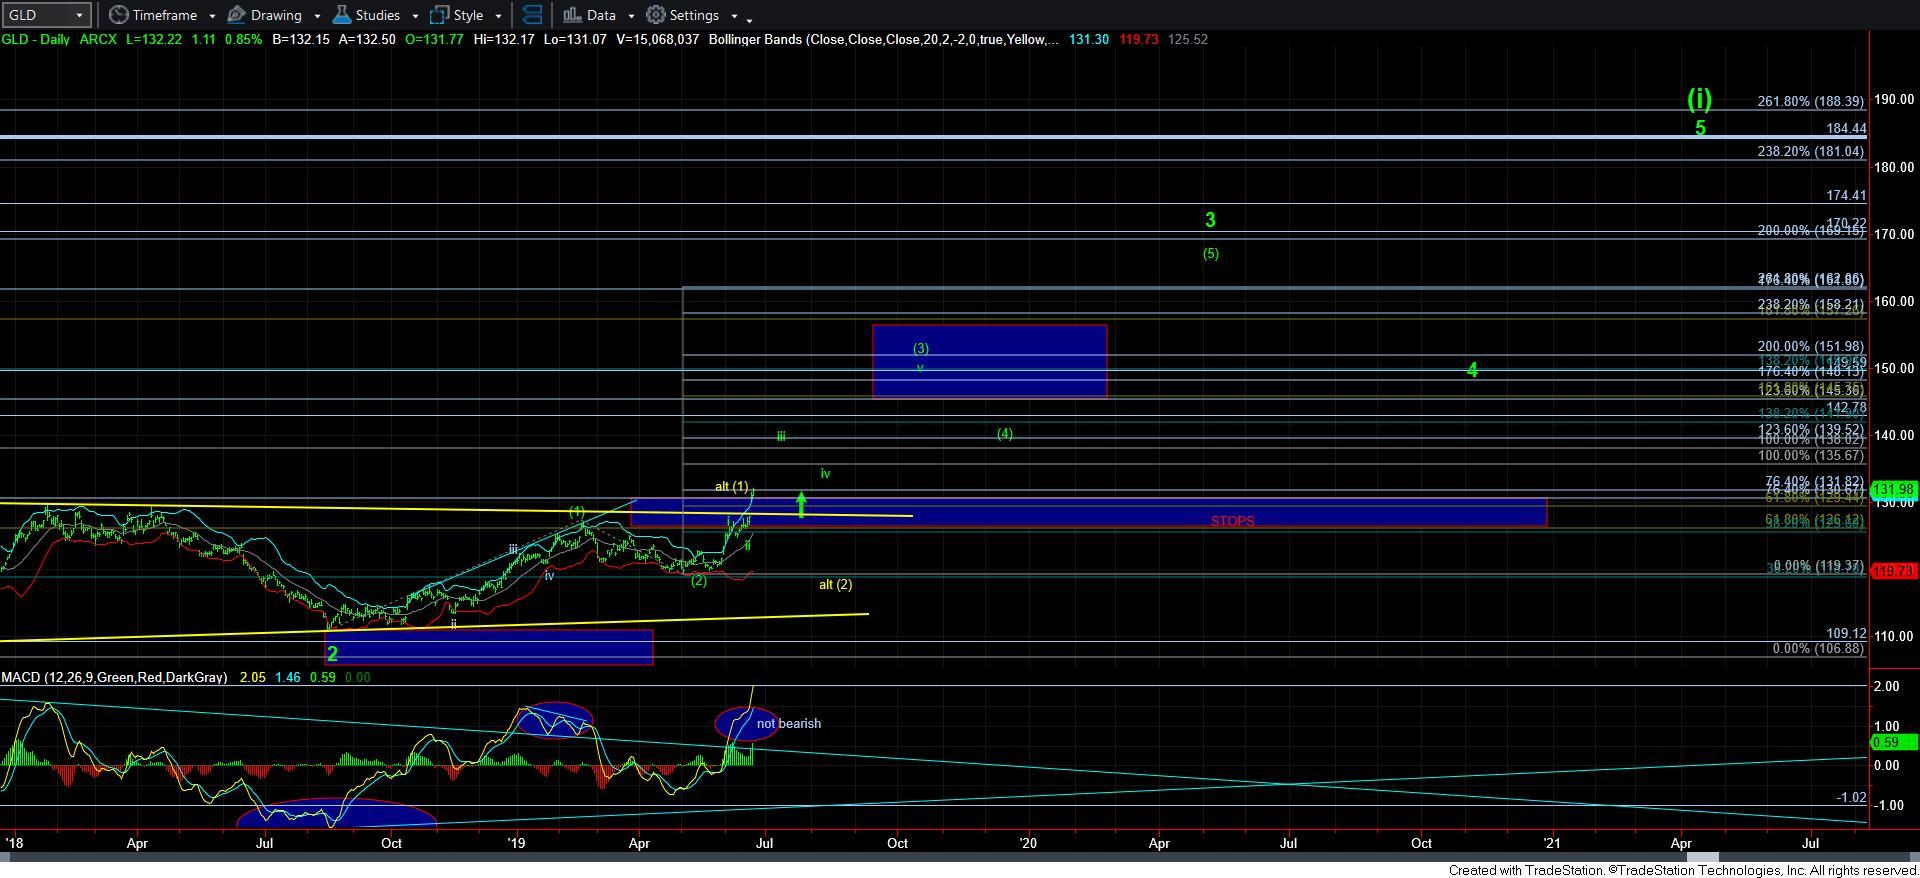
With the market gapping up over resistance this past week, we must recognize that it is often a signal of the start of a 3rd wave, as they often initiate with large gaps, and often see many more. Moreover, if you glance at the daily MACD on both the GDX and GLD charts, they are still pointing straight up. And when they are in this posture, this is also indicative of the heart of a 3rd wave. So, until GDX and GLD break down below a pivot, I have to give the bulls the benefit of the doubt with all the indications I am seeing.
The one fly in the ointment thus far is silver. But, please remember that silver and gold do not always move together. Remember that silver topped in April of 2011, whereas gold continued to race higher parabolically, and did not top out until 5 months later. So, despite gold’s continuing higher now, as long gold maintains its current trajectory, then I expect silver to stage a fast and furious comeback. In fact, if gold continues in its bullish posture over support, silver will likely stage a breathtaking rally to catch up, which is what is often seen in this complex. So, the fact that silver has lagged is not terribly dispositive to me at this point (nor bearish) – that is, as long as GLD and GDX continue to maintain support over their pivots.
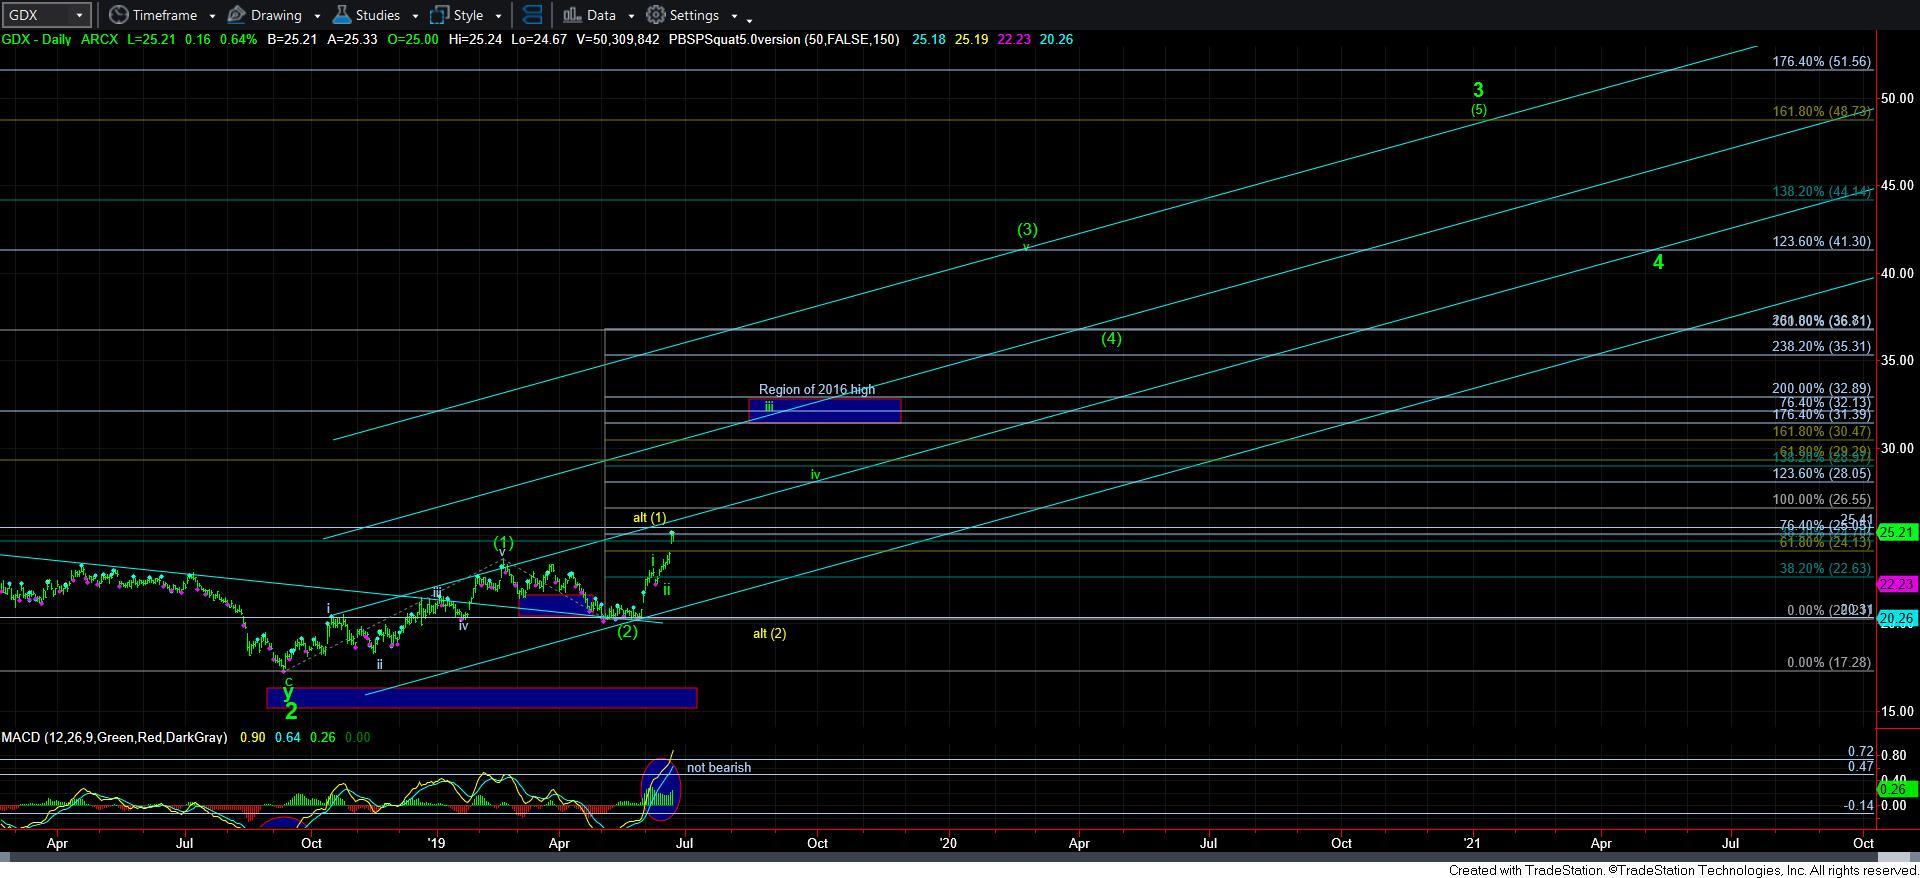
Alternatively, if we are to see GLD and/or GDX break down below a pivot, then it would warn me that the market may be rallying in a diagonal structure (as Garrett and Zac have been tracking on a number of mining stocks), rather than a standard impulsive structure I am tracking on my charts for GLD and GDX. So, I want to clearly note that I do not have a structure which I feel is a high probability bearish structure after the recent break out. Yet, if we break a pivot support, we certainly could see more pullback/consolidation before the bull market takes hold in earnest. But, the weight of evidence suggests that the metals have now finally moved into a bullish posture after a long and frustrating 3-year consolidation.
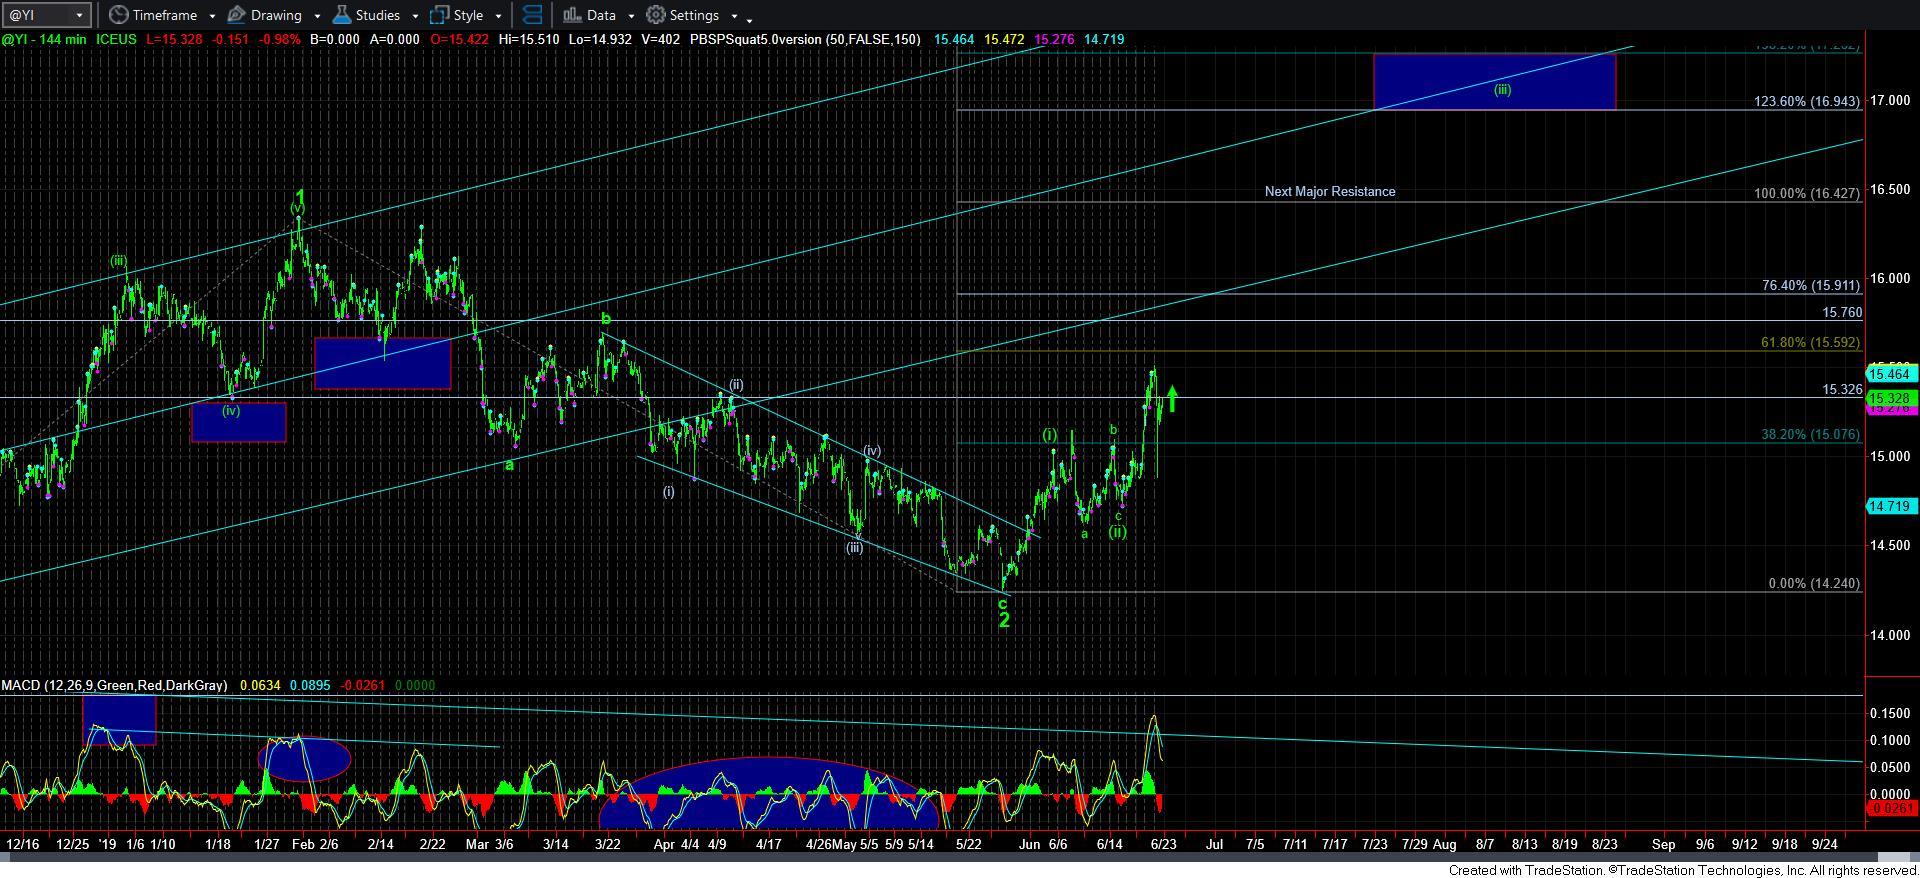
I want to add one further warning. This market has now surprised many investors and traders by this move up. In fact, many were even caught shorting for many reasons. And, this market does not often allow a gentleman’s entry. So, while some have stopped out on their short trades and are expecting the market to pullback so they can get an entry on the long side, experience has taught me that this can be a cruel market in regard to letting people board the train once it has left the station. Maybe they will be lucky enough to see such an opportunity. But, clearly, my money is not betting on it as long as we continue to hold our support pivots, which we will continue to raise should the price continue to rise.
The bottom line is that as long as GLD and GDX maintain support over their respective pivots, I will continue looking immediately higher as shown on the daily charts, and I think it is only going to be a matter of time before silver follows. However, if a pivot support does break in the coming two weeks, then I will look for another consolidation before we continue higher. But, the weight of evidence suggests that the bull market has returned and I will predominately be looking higher over the coming year. Yet, that does not mean we throw caution to the wind, and maintain a blindly bullish stance, especially until silver is able to catch up in a meaningful way. But, once silver gets with the program, that will be the final piece to complete this puzzle.
