🥇 First rule of investing? Know when to save! Up to 55% off InvestingPro before BLACK FRIDAYCLAIM SALE

It Could Be Make Or Break For The Aussie, With Several Pairs Sitting At Support

Published 09/27/2019, 02:26 AM
USD/JPY
-
AUD/USD
-
AUD/CHF
-
AUD/JPY
-
AUD/NZD
-
AUD/USD Chart

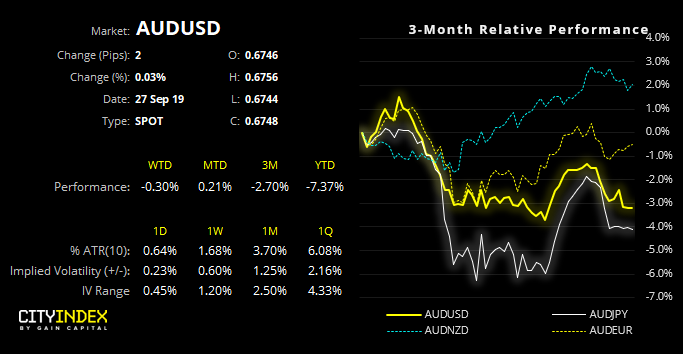
With several AUD pairs sitting at key levels, it could be approaching a time for a make or break for the Aussie
AUD/USD Chart

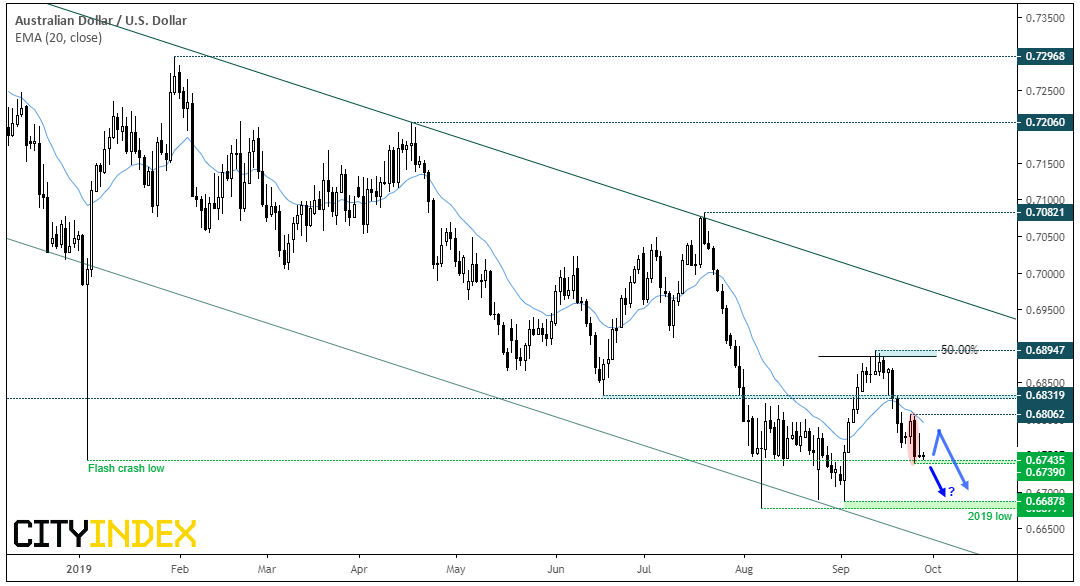
AUD/USD remains within an established bearish channel on the daily chart. The September rally stalled around the 50% retracement level before rolling over, and prices are now interacting with the flash-crash low set early January. With the 20-day eMA capping the weekly high and Wednesday providing a bearish engulfing candle, the swing high could be in place at 0.6806. Yesterday’s inside bar shows compression is underway, which can be the prelude to range expansion.
  • Bias remains bearish below 0.6806.
  • Bears could take a break of Wednesday’s low as a sign the bearish trend is set to resume.
  • Initial target would be around 0.6700 (round number) which is just above the YTD lows. A break beneath 0.6674 brings the lower channel into focus for bears.
  • AUD/CHF is also worth keeping tabs on as the setup is quite similar.
  • AUD/JPY Daily Chart

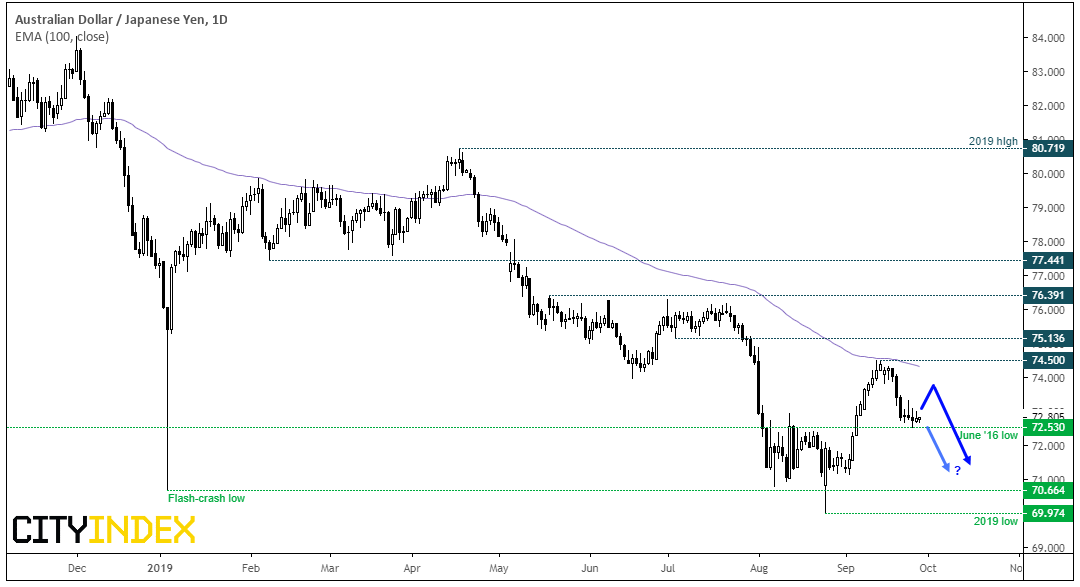
    AUD/JPY is consolidating above the June 2016 low and will likely track the direction of sentiment; so if indices and USD/JPY are to continue to rebound we could see USD/JPY rise in tandem, whereas if they turn lower, this FX barometer of risk could break through key support and bears take another crack at the year to date lows. Whilst a near-term bounce could be possible, we’d favour an eventual break lower due to the dominant bearish trend.
  • The daily trend remains bearish below 74.50, although a minor rebound from current levels seems plausible.
  • If prices rebound, a lower high beneath 74.50 could be a sign that momentum is trying to revert to the dominant trend.
  • Bears could take a break beneath 72.50 as a sign prices are set to head lower.
  • Monitor price action on S&P500 and USD/JPY to help assess the likely direction of AUD/JPY.
  • AUD/NZD Daily Chart

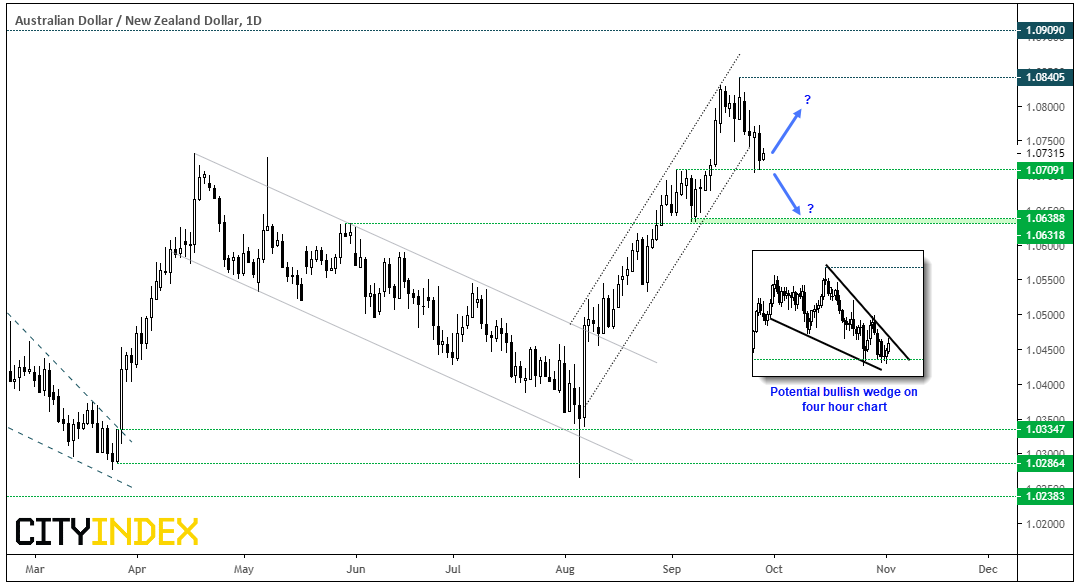
    AUD/NZD has broken out of its latest channel, although the downside break is yet to compel. Wednesday’s bullish hammer respected support around 1.0700 and spoiled the potential double top pattern previously highlighted. Still, yesterday’s bearish candle spanned most of the hammer’s range and closed near the lows, so bulls are not out of the woods yet. That said, we note a potential bullish wedge forming on the four-hour chart with a small bullish divergence, so 1.0700 appears to be a key level going forward for bulls and bears.

  • Bears could wait for a break below 1.7000 before considering shorts, with the lows around 1.0631/38 as a target
  • Bulls could wait for a breakout from the wedge on the four-hour chart, using Thursday’s high as a initial target (the base of the wedge), followed by 1.0800 and the 1.0840 high.
  • Original Post

    Latest comments

    Loading next article…
    Risk Disclosure: Trading in financial instruments and/or cryptocurrencies involves high risks including the risk of losing some, or all, of your investment amount, and may not be suitable for all investors. Prices of cryptocurrencies are extremely volatile and may be affected by external factors such as financial, regulatory or political events. Trading on margin increases the financial risks.
    Before deciding to trade in financial instrument or cryptocurrencies you should be fully informed of the risks and costs associated with trading the financial markets, carefully consider your investment objectives, level of experience, and risk appetite, and seek professional advice where needed.
    Fusion Media would like to remind you that the data contained in this website is not necessarily real-time nor accurate. The data and prices on the website are not necessarily provided by any market or exchange, but may be provided by market makers, and so prices may not be accurate and may differ from the actual price at any given market, meaning prices are indicative and not appropriate for trading purposes. Fusion Media and any provider of the data contained in this website will not accept liability for any loss or damage as a result of your trading, or your reliance on the information contained within this website.
    It is prohibited to use, store, reproduce, display, modify, transmit or distribute the data contained in this website without the explicit prior written permission of Fusion Media and/or the data provider. All intellectual property rights are reserved by the providers and/or the exchange providing the data contained in this website.
    Fusion Media may be compensated by the advertisers that appear on the website, based on your interaction with the advertisements or advertisers.
    © 2007-2024 - Fusion Media Limited. All Rights Reserved.