Wow! No sooner had I published my post cautioning readers to Watch these lines in the sand, then all four of my tripwires were triggered on Thursday. At that point, I got a number of questions from readers amounting to "what do I do now?" (For the answer, please see my post Why this isn't investment advice).
Let's survey the technical damage that was done on Thursday and carried through to Friday. First and foremost, emerging market bonds continued to crater. Never mind the spread between EM bonds and Treasuries, look at the relative performance of EM bonds against US high yield, which broke an important relative support line.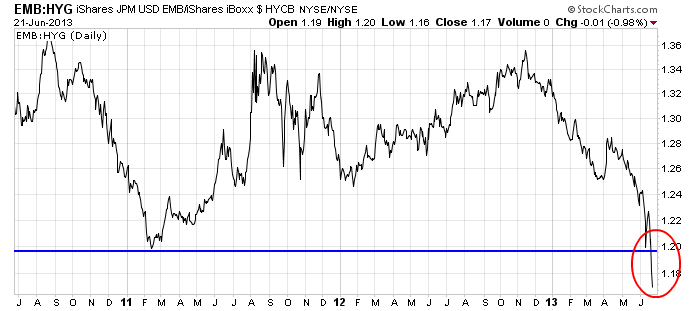
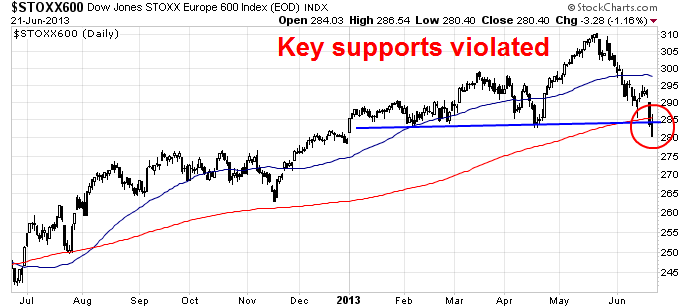
The line in the sand for the 10-year Treasury yield was 2.4%, which was breached Thursday and decisively on Friday.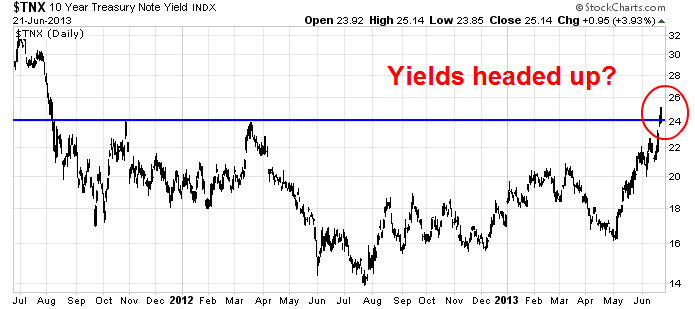 During this current stock market advance, European equities had halted bouts of weakness at the 200-day moving average. That support level was also broken.
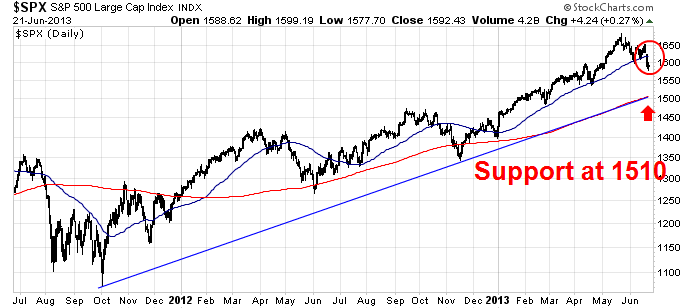
 On this side of the Atlantic, the 50-day moving average provided support for the SPX. The index went through the 50 DMA convincingly this past week. However, my analysis of market internals indicates that the current weakness is likely to be just a minor correction. The most obvious support level from which this pullback ends is roughly the 1510 level, which represents the 200 DMA and the uptrend line that stretches back to October 2011.
 Bullish silver linings
There is no doubt that the equity bull trend experienced technical damage and a period of volatility and weakness is likely to follow. However, I believe that we will only experience a minor pullback for the following reasons:
- The PBoC dramatically blunted tail risk on Friday with its liquidity injections;
- Insiders are buying; and
- Market internals remain bullish.
Let's go through the points one at a time. On Friday, Bloomberg reported on the People's Bank of China (PBoC) inject:
China’s benchmark money-market rates retreated from records after the central bank was said to have made funds available to lenders amid a cash squeeze.
The one-day repurchase rate dropped 384 basis points, or 3.84 percentage points, to 7.90 percent as of 9:33 a.m. in Shanghai, according to a weighted average compiled by the National Interbank Funding Center. That is the biggest drop since 2007. The seven-day rate fell 351 basis points to 8.11 percent. They touched record highs yesterday of 13.91 percent and 12.45 percent, respectively.
I was highly concerned about tail risk because of the tight liquidity conditions in China, as it had the makings of a credit crunch. The PBoC was at risk of making a policy mistake, which could have evolved into a Lehman moment (as Zero Hedge is fond of pointing out). The act of liquidity injection alleviated many of those concerns.
Insiders are buying
Another intermediate term bullish factor is the emergence of insider buying. Mark Hulbert reported that corporate officers and directors have been leaning towards the buy side:
Based on his [finance academic Nejat Seyhun] analysis of how the stock market has tended to perform in the past whenever insiders were behaving like they are today, his best estimate is that the Wilshire 5000 index will rise 6.7% over the coming 12 months. Though that is lower than the stock market’s historical average return of around 10%, it would be a far better outcome than the decline that many on Wall Street worry will be the result of the Fed dialing back its stimulus program.
Past research has shown that insider buying is far more significant a signal than insider selling. Insiders may sell for all kinds of reasons. On the other hand, if an insider puts up his own hard earned cash to buy the shares of his own company, it's a far more significant indicator.
Positive market internals
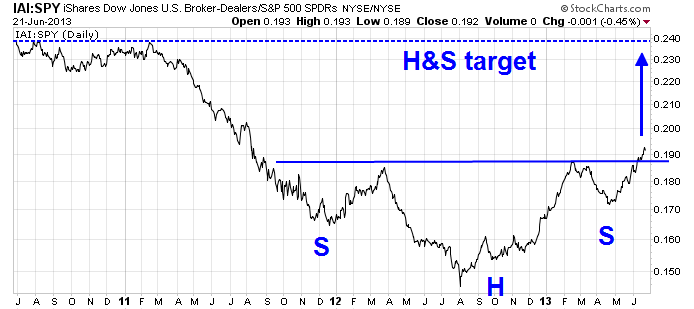
In addition, market internals are not highly atypical of a severe downturn in the economy or rising systemic risk. For instance, I was concerned about the contagion risk posed by the EM sell-off. If the market believes that contagion risk is rising, it should show up in the relative performance of financials. Consider the chart below of US financials against the market, which remains in a relative uptrend. In effect, Mr. Market is saying, "What financial contagion risk?"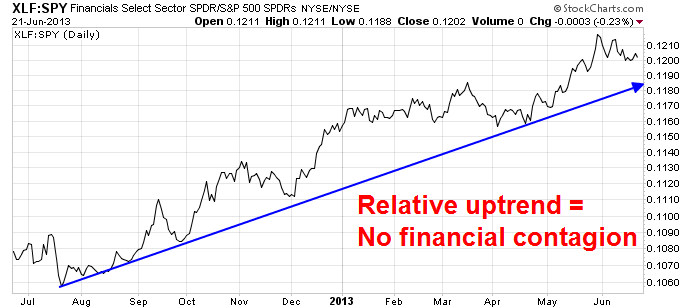 Look at the relative performance of the Broker Dealers against the market. Broker Dealers represent the "high beta" portion of the financial sector. Not only is this group not selling off, it appears to have formed a head and shoulders pattern on a relative basis, which suggests further outperformance to come.
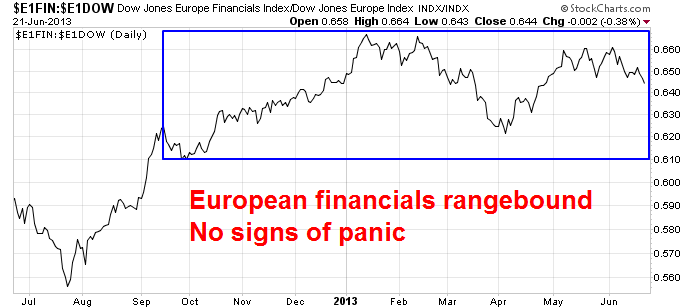
 Take a look at the financials in Europe. While its near-term relative weakness may be reflective of anxieties over Greece, European financials remain range-bound against the broader market and Mr. Market is showing little sign of anxiety in this sector.
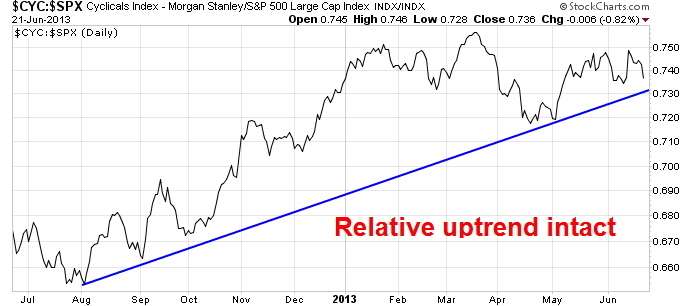
 In the US, the economically sensitive sectors continue to perform well and display no signs of any severe concerns about an economic slowdown. The Morgan Stanley Cyclical Index remains in a long and well defined relative uptrend against the market.
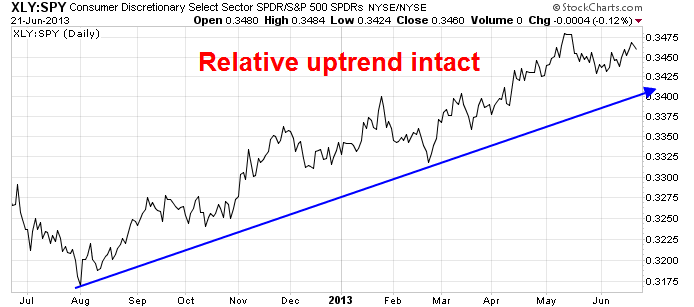
 Similarly, the Consumer Discretionary stocks remain in a relative uptrend.
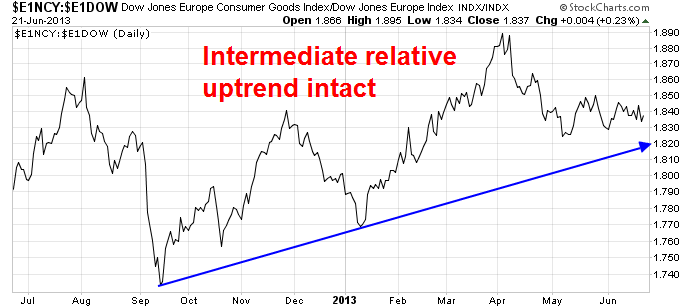
 I see a similar pattern in Europe. Here is the relative performance of the European Consumer Goods sector, which is in a choppy relative uptrend:
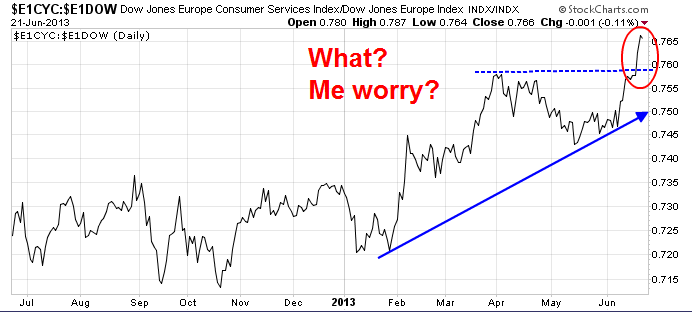
 ...and European Consumer Services, which staged an upside relative breakout in June:
 Not out of the woods yet
These factors combine to paint a picture showing that the bears have a lot of work to do before taking control of the tape on an intermediate term basis. Unless the picture deteriorates, the current combination of insider buying and sector internals suggests to me that the stock market is due for a period of pullback and consolidation, but the outlook is no disaster.
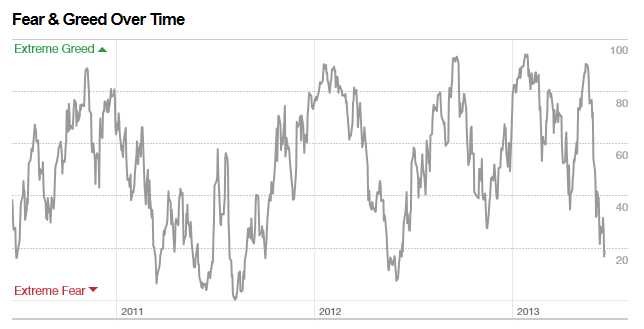
However, stocks are not out of the woods in the near term. To put it simply, the market is oversold, but it's not severely oversold. The chart below shows the NYSE New highs - New Lows on the top panel and the SPX on the bottom panel. The NH-NL indicator is in oversold territory, but it hasn't reached the kinds of severe oversold readings that are consistent with the end of corrections.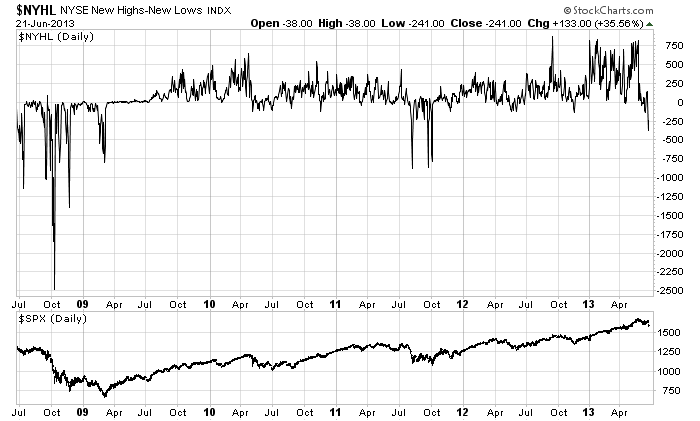 CNN Money maintains a fear-greed index based on the combination of junk bond demand, market momentum, safe haven demand, put and call options, stock price strength and stock price breadth. As the chart below shows, readings are in fear territory, but they are not quite at severe extremes yet.
 A correction and consolidation
To summarize, the PBoC's liquidity injection late last week signaled that tail risk in China has been drastically reduced. Nevertheless, we have seen considerable technical damage done to the equity bull. Markets remain jittery and every headline that comes across the tape about the timing of the Fed's QE taper will result in a risk-on or risk-off reaction.
However, insider activity and sector internals do not suggest that the global economy is turning down, which is bullish. Unless Street earnings expectations were to get revised down dramatically or the Chinese banking system liquidity flared up again, my base case is that the stock markets undergo a period of correction and consolidation. For the US averages, the likely floor under such a scenario is 1510 on the SPX.
Disclaimer: Cam Hui is a portfolio manager at Qwest Investment Fund Management Ltd. ("Qwest"). This article is prepared by Mr. Hui as an outside business activity. As such, Qwest does not review or approve materials presented herein. The opinions and any recommendations expressed in this blog are those of the author and do not reflect the opinions or recommendations of Qwest.
None of the information or opinions expressed in this blog constitutes a solicitation for the purchase or sale of any security or other instrument. Nothing in this article constitutes investment advice and any recommendations that may be contained herein have not been based upon a consideration of the investment objectives, financial situation or particular needs of any specific recipient. Any purchase or sale activity in any securities or other instrument should be based upon your own analysis and conclusions. Past performance is not indicative of future results. Either Qwest or Mr. Hui may hold or control long or short positions in the securities or instruments mentioned.
