A few weeks ago we noted the yen's advance as risk-off sentiment pervaded the markets. The reflation trade was deflated by the Trump administration’s setback regarding healthcare reform. Markets, more significantly, further questioned the Fed, the supposed ‘dovish hike’ and their desire to increase interest rates at least three times this year. A classic risk-off move ensued with the big dollar dropping below 100, commodity dollar currencies weakened and gold was bought.
However since the end of March, the dollar has slowly climbed, bouncing off the widely watched 200-day moving average. Markets have slowly realized that the Fed is in gradual hiking mode and President Trump lives to tweet another day about his other fiscal plans, like tax and infrastructure.
In this light, it's prudent to ask if the yen strength that we have seen over this period has now abated. For this, we like looking at crosses like EUR/JPY and AUD/JPY, which clearly shows these recent moves.

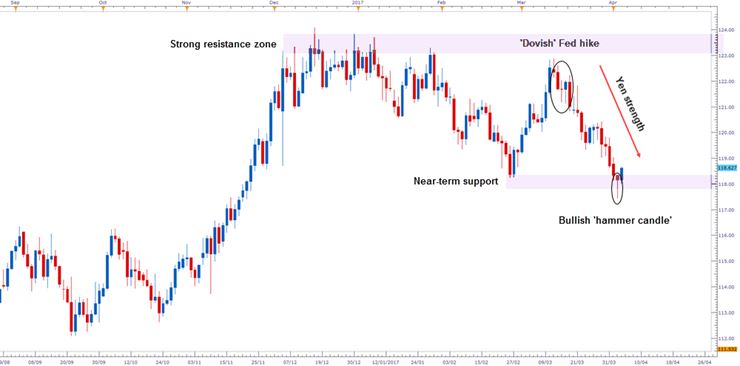
EUR/JPY bumped up against strong resistance in the 1.2300 area in December and January. It failed again to reach this level when the Fed hiked rates as expected at its March meeting and dropped to near-term support in the 118.00 zone.
We can see the makings of a strong reversal pattern in this pair — a bullish ‘hammer candle’. This candlestick signal has a long, lower shadow and little or no upper shadow. We therefore now need to see further upside follow through in the form of a long blue candlestick or preferably a gap up, which should be seen in one to three days.

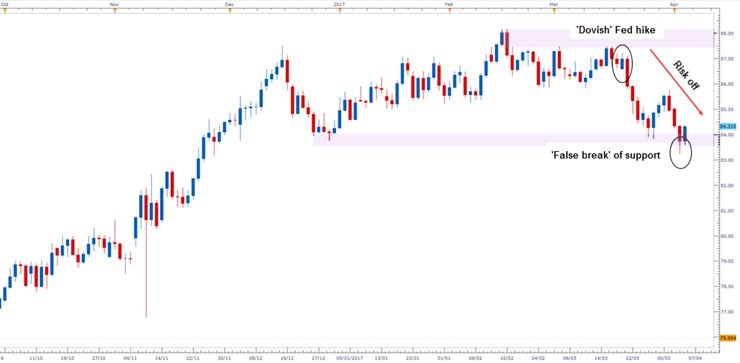
Similarly, AUD/JPY, the classic ‘risk-on’ pair topped above 88 before declining after the Fed hike. There is now a potential ‘false break’ around the support level at 83.50.
Going forward, we look to the FOMC minutes to give direction to determine if these moves are a simple retracement in a medium-term downtrend or the end of yen strength for the near future.
