Verizon Communications (NYSE:VZ) has come a long way from its humble origins in the Bell breakup. It has grown from a small eastern seaboard phone company into one of the largest digital communications networks in the country.
Most recently, Verizon has dominated tech- and finance-industry news with its bid to buy Yahoo! (NASDAQ:YHOO). The ailing internet services provider could use a facelift. And Verizon is prepared to take on that challenge.
But mergers of this size are not orderly events. (And as we recently covered, they often don’t receive approval.) Sure, Yahoo has stumbled in recent years, but it’s still worth $40 billion. An acquisition like this will be a serious strain on Verizon’s resources.
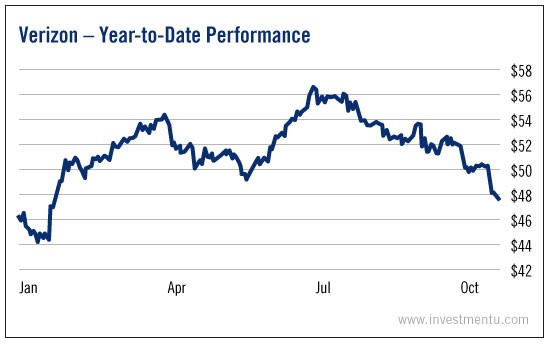
Is Verizon stock prepared for it? It’s hard to say. Shares are up for the year, but not by a ton.
This deal with Yahoo could make or break Verizon. It could be the beginning of a new phase for both companies. Or it could mark the end of Verizon’s stability in the telecom space. With that in mind, Investment U readers want to know: What should you do with Verizon stock?
To find out, we ran it through the Investment U Fundamental Factor Test. (As a reminder, our checklist looks at six key metrics to diagnose the financial health of a stock.)
- Earnings-per-Share(EPS) Growth: Verizon doesn’t give us a promising start with regard to earnings. Its earnings per share have shrunk in the last year, with a growth rate of -10.10%. Other telecoms are down too, but not as badly. The industry average is -3.28%.
- Price-to-Earnings (P/E): The company redeems itself a bit with its price-to-earnings ratio. It’s just 12.23, a little more than a third of the industry average, which is 34.72. That indicates that the market is excessively bearish on Verizon stock, relative to its competitors.
- Debt-to-Equity: Telecom is an expensive business, and many of Verizon’s peers are highly leveraged. The average debt-to-equity ratio is 125.37%. But Verizon has even more debt than that. Its ratio of 484.88% is worryingly above average.
- Free Cash Flow per Share Growth: This is a very bad omen for Verizon. While other telecoms have respectable cash flows of 24.95% per share, Verizon has seen free cash flow per share drop -86.89%. That is not the number we were hoping for here.
- Profit Margins: Verizon returns to above average here. Its profit margin of 11.70% is a decent bit higher than the industry average of 8.87%, which is already quite good.
- Return on Equity: The company ends on a very good note with its return. Verizon equity has earned 83.48% in the last year, compared to average returns of 18.11% among competitors.
In sum, Verizon is doing OK. Its profit margins and return on equity are strong. And the market isn’t giving it the credit it deserves. But the company’s predicament is a bit weaker than we’d like to see from a company that’s about to spend a few billion.
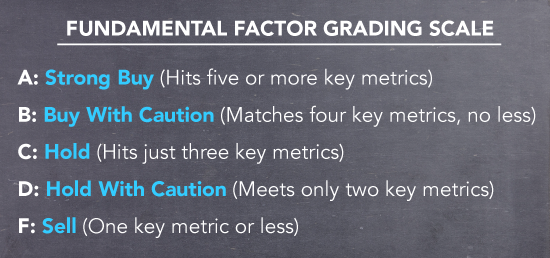
Verizon’s earnings, debt burden and cash flows are all causes for concern. And in the short term, its merger with Yahoo could make matters worse. Hopefully, the acquisition will give Verizon momentum and opportunities for growth in the long term. Only time will tell. For these reasons, Verizon stock has earned a grade of C.
Fundamental Factor Test Score
- C: Hold (Meets just three key metrics)


