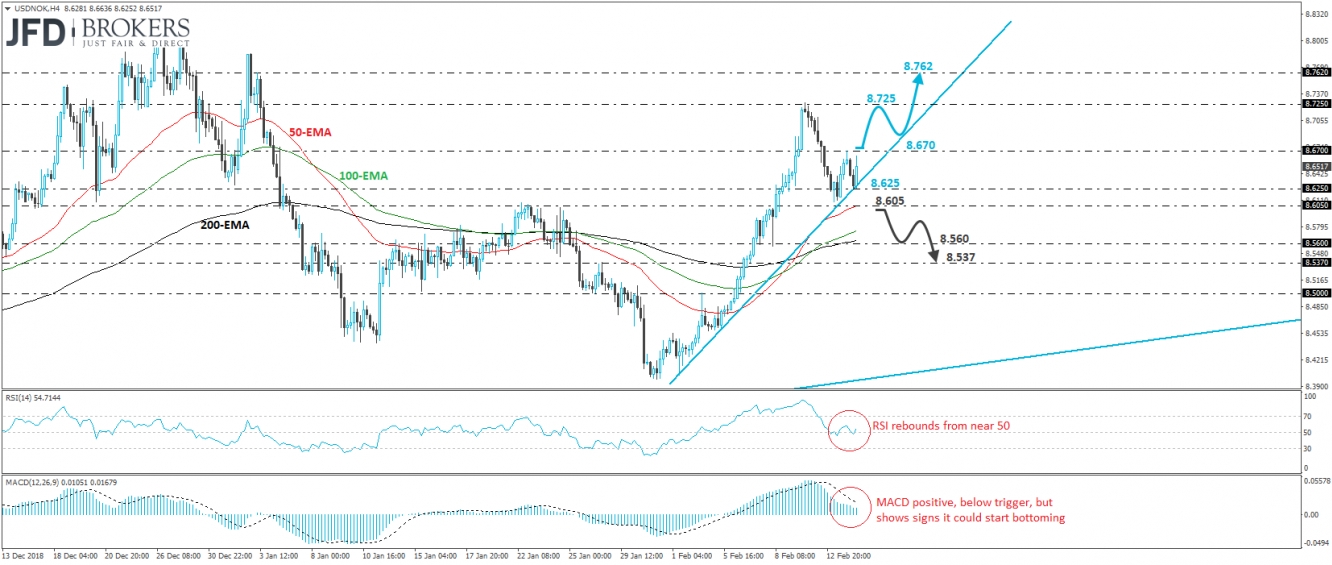
USD/NOK traded higher on Thursday, after it hit support at 8.625, near the short-term uptrend line drawn from the low of February 1st. On the 8th of the month, the rate emerged above 8.605, that way completing a non-failure swing bottom formation. Even after the rate tested the 8.725 zone and corrected sharply lower, the setback remained limited above 8.605. This, combined with the fact that the rate remains above all three of our moving averages, keeps the near-term picture positive.
That said, we would like to see a clear break above 8.670, which is yesterday’s high, before we get confident on another leg higher. Such a break could set the stage for another test at the 8.725 hurdle, near Monday’s high. If this level fails to stop the bulls this time, its break would confirm a forthcoming higher high on the 4-hour chart and may allow extensions towards 8.762, marked by an intraday swing high formed on January 3rd.
Shifting attention to our short-term oscillators, we see that the RSI rebounded from near its 50 line, while the MACD is positive and, although below its trigger line, shows signs that it could start bottoming as well. These indicators suggest that the rate may start gaining upside momentum again soon, which supports the notion for some further recovery, at least in the short run.
On the downside, we would like to see a clear and decisive dip back below 8.605 before we start examining whether the bulls have abandoned the action, even for a while. Such a move could signal the break of the aforementioned upside support line and would confirm a forthcoming lower low. We may then experience a slide towards the 8.560 zone, marked by the low of February 8th, the break of which could encourage the bears to put the low of the previous day on their radars, at around 8.537, a support also marked by the high of January 28th.

