You should be concerned with those who claim debt is subsiding, and therefore the government should continue high spending to stimulate the economy. Paul Krugman in a New York Times Op-Ed stated:
But after peaking in 2009 at $1.4 trillion, the deficit began coming down. The Congressional Budget Office expects the deficit for fiscal 2013 (which began in October and is almost half over) to be $845 billion. That may still sound like a big number, but given the state of the economy it really isn’t. Bear in mind that the budget doesn’t have to be balanced to put us on a fiscally sustainable path; all we need is a deficit small enough that debt grows more slowly than the economy. To take the classic example, America never did pay off the debt from World War II — in fact, our debt doubled in the 30 years that followed the war. But debt as a percentage of G.D.P. fell by three-quarters over the same period. Right now, a sustainable deficit would be around $460 billion.
The surprise for most is that Professor Krugman is correct in what he said. The reality is that there are a few big but’s. Here are four reasons to be concerned with any rationale which says debt build issue is behind us.
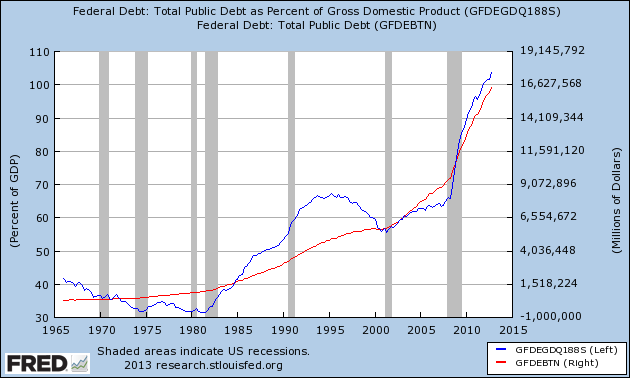
1. Since 1965 Debt Size Does Correlate with Debt Percent of GDP

There is a very high correlation between size of debt and percent of GDP.
2. Debt Constrains Economic Performance?
There is enough evidence that sovereign debt constrains economic performance. From Debt Overhangs: Past and Present (Carmen M. Reinhart, Vincent R. Reinhart, and Kenneth S. Rogoff):
We identify 26 episodes of public debt overhang–where debt to GDP ratios exceed 90% of GDP–since 1800. We find that in 23 of these 26 episodes, individual countries experienced lower growth than the average of other years. Across all 26 episodes, growth is lower by an average of 1.2% . If this effect sounds modest, consider that the average duration of debt overhang episodes was 23 years.
3. Economic Forecasts Never Forecast a Recession
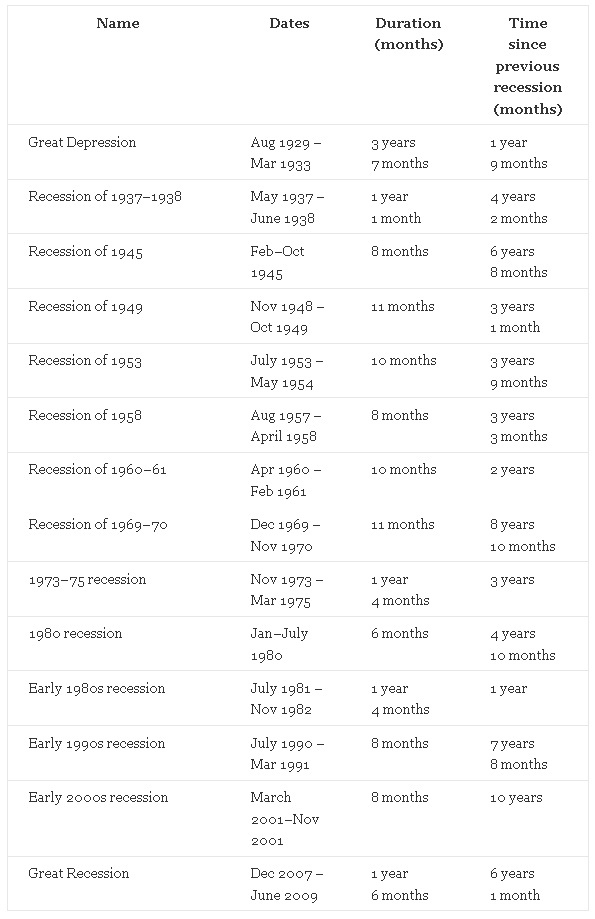
The Great Recession ended in 2009. When will the next recession hit? According to the Congressional Budget Office’s data which Professor Krugman used – never. This just does not stack up against history. (hat tip to Wikipedia for table below):
Time Between Recessions in the USA 
Recently recessions have occurred between 6 to 10 years following the end of the previous recession. The probability is that the next big one hits between 2015 and 2019. Where is the rainy day debt reduction? Again quoting Professor Krugman:
Smart fiscal policy involves having the government spend when the private sector won’t, supporting the economy when it is weak and reducing debt only when it is strong.
Professor Krugman goes on to argue the economy is not strong – which requires more government debt. The problem is the next recession will hit without debt reduction and then the government will be forced to add to the debt because “the private sector won’t“.
4. Using Economic Growth Forecasts to Argue the USA Will Reduce the Debt
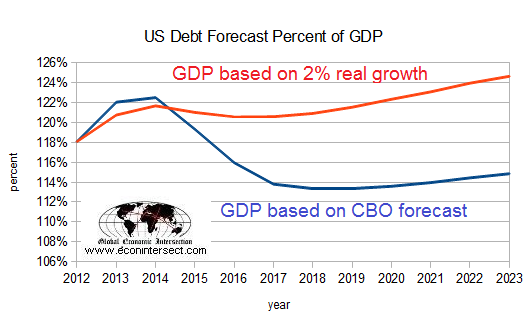
Economic forecasts are imaginary situations – and the longer the timeframe of the forecast, the more “Alice in Wonderland” it becomes. Going back to the referenced CBO study, they predicted nominal gdp to hit 6% or better in years 2015 to 2017. If one uses real GDP at 2% – the results are significantly different for the possibility of debt reduction. 
Even if the CBO forecast is correct, the debt starts growing in 2018 with only and relatively insignificant reduction in the meantime. Never even coming close to getting under 90% of GDP. And who knows what the sequester talks will bring.
Conclusion
There is way too much evidence to believe it is safe for the government to go on a spending spree considering the current size of USA sovereign debt. Yet Professor Krugman may be correct that a pulse in government spending might be needed to reignite the economy to levels last seen in the 1990′s. The USA likely has few other choices than to nuke some or all of its debt to get it back to manageable levels, or simply stop accounting for it.
The large size of the debt is limiting economic options.
Other Economic News this Week:
The Econintersect economic forecast for March 2012 continues to show weak but somewhat improving growth. The supply chain contraction we saw last month has dissipated with all of our check methods of measuring the economy clearly in expansion territory.
ECRI now believes a recession began in July 2012. ECRI first stated in September 2011 a recession was coming . The size and depth is unknown. The ECRI WLI growth index value has been weakly in positive territory for over three months – but in a noticeable improvement trend. The index is indicating the economy six month from today will be slightly better than it is today.
Current ECRI WLI Growth Index 
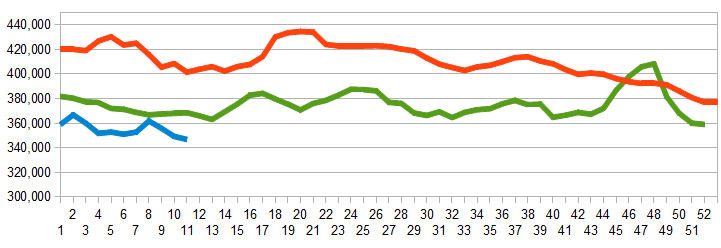
Initial unemployment claims fell from 340,000 (reported last week) to 332,000 this week. Historically, claims exceeding 400,000 per week usually occur when employment gains are less than the workforce growth, resulting in an increasing unemployment rate (background here and here).
The real gauge – the 4 week moving average – also improved from 348,750 (reported last week) to 346,750. Because of the noise (week-to-week movements from abnormal events AND the backward revisions to previous weeks releases), the 4-week average remains the reliable gauge.
Weekly Initial Unemployment Claims – 4 Week Average – Seasonally Adjusted – 2011 (red line), 2012 (green line), 2013 (blue line)
Bankruptcies this Week: Geokinetics,
Data released this week which contained economically intuitive components (forward looking) were:
- Rail movements are somewhat improving.
- retail sales – normally this is a lagging indicator, but our analysis is that the trend may be changing to the downside.
Weekly Economic Release Scorecard:
Click here to view the scorecard table below with active hyperlinks

