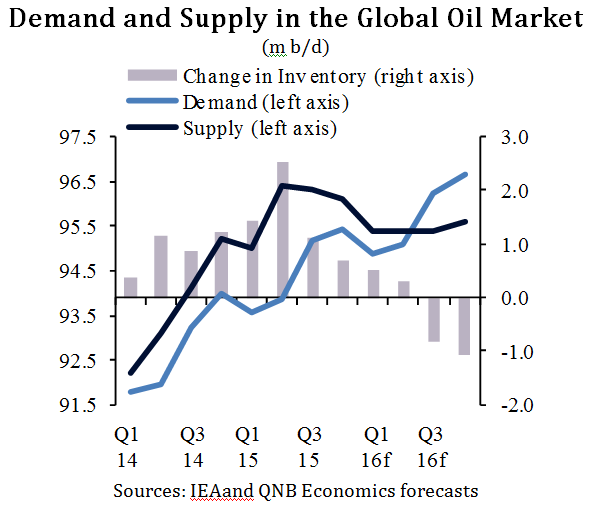
Oil markets have been over-supplied since the beginning of 2014. As supply growth outpaced that of demand, markets have become imbalanced, leading to alarge build-up of inventories and a sharp fall in prices. But oil markets, like other markets, have a tendency to adjust, and to clear excess supply. The adjustment was expected to take the form of supply cuts among high-cost producers (mainly in the US) as well as a pickup in demand as low prices encourage higher consumption. The latest data suggest that the adjustment process is already underway, although the market is not expected to clear until the second half of 2016.
US oil production has so far been resilient to the decline in oil prices, but less resilient than previously thought. In August, the US Energy Information Administration (EIA) changed its methodology for estimating US crude production. The new methodology is based on surveying producers directly rather than relying on incomplete state-level data. The new estimates show that the US is pumping less oil than previously reported. For example, in the month of June, the difference is around 149k barrels per day (b/d). Both the old and new methodology show US oil production peaking in April this year, but the speed of subsequent decline is higher under the new methodology.
The fall in rig count, which has resumed again after stalling mid-year, also confirms that US shale oil production might already be past its peak. We have previously argued that there is no link between rig count and oil production because producers tend to first shut down wells in the least productive regions. However, the EIA data now show accelerating output declines at the seven most productive regions. Furthermore, due to the large cuts in capital expenditure, any rebound in drilling activity is unlikely to happen in the short term. Consequently, the International Energy Agency (IEA) forecasts that the US production of light tight oil will fall by 0.4m b/d from 2015 to 2016.
On the demand side, the IEA expects additional demand to rise to a five-year high in 2015, reaching 1.7m b/d. This is remarkable given that global economic growth is forecast to hit a six-year low this year, according to the International Monetary Fund. The pick-up in demand is due to lower oil prices, which are encouraging higher consumption, particularly among US motorists. Demand was also boosted by a cold European winter in the first quarter of this year and China’s continued purchases of crude oil despite its economic slowdown and financial market turmoil, partly to fill up its strategic reserves.

What does this mean for the demand/ supply balance? Despite the strong demand growth, markets are still expected to be oversupplied by 1.5m b/d in 2015, reflecting additional production from both OPEC and non-OPEC countries. Continued demand growth in 2016 (1.2m b/d according to the latest IEA’s forecasts) and production cuts in non-OPEC countries (0.4m b/d, mostly from US shale oil) should tip the market back into balance in the second half of 2016 (see chart).
However, potential increased OPEC production due to the lifting of economic sanctions on Iran could delay the re-balancing until 2017.
Overall, we continue to forecast that oil prices will stabilise around an average of USD 55.0 in both 2015-16 before picking up to USD 60.2 per barrel in 2017 as the supply glut gets gradually eliminated. The adjustment in the market is working as expected, but the process is slow and protracted.
