….. the fiscal (government) deficit in the US cannot go away unless we also deal with the trade deficit. As we will see, it is a simple accounting issue, and one based on 400 years of accepted accounting principles. - John Mauldin
Trade deficit is currently a headwind to GDP. This is as obvious as:
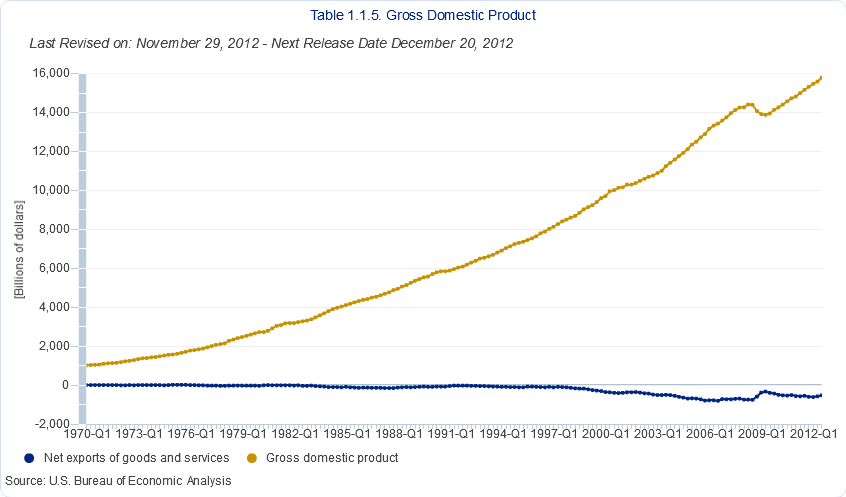
GDP = private consumption + gross investment + government spending + (exports − imports).
In 2011, the trade balance headwind to GDP was more than a 0.5% drag.

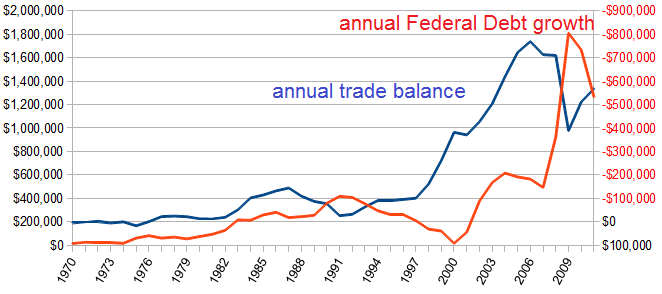
It does appear as if there is some correlation (although far from perfect as you look at the divergence during the 1990s) between the yearly USA Federal debt growth and trade balance.

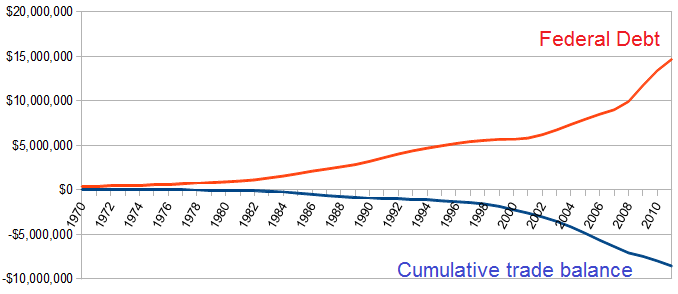
If one steps further back, the cumulative trade balance deficit and US Federal deficit are growing somewhat at the same pace.

The equation leading to this belief in the association between debt and trade is:
Domestic Private Sector Financial Balance + Governmental Fiscal Balance – the Current Account Balance (or Trade Deficit/Surplus) = 0
This is the central exhibit of Wynne Godley’s sectoral balance workof the 1980s and 1990s (for which some think he would have a Nobel Prize had he not passed away too soon). The problem is:
- the world economies are now globalized,
- the USA economy is not the only game in town,
- all these equations treat economies like they live in separate bubbles,
- the dollar itself is THE global currency with massive use outside the boundaries of the United States – and this global use is not part of GDP,
- the dollar is a fiat currency – and unlike a backed currency, its dynamics do NOT need to add up (1 + 1 = 3).
Global Dollars spent = Global Dollars received
As the US has globalized, the trade deficit (or surplus) would be disconnected from internal economic measures such as financial balances or even GDP. This is one reason I continue to talk down GDP as a measure of the economy as the trade balance is an element of GDP.
This does not mean debt is not an issue. Over the entire global economy today about 35-40% of GDP goes to pay interest. How unproductive is that? Debt is likely limiting economic growth in the USA.
Nor does it mean the trade balance is not an issue. No economy should be dependent on another for a significant portion of a strategic product, and no matter how you cut it – IMPORT imbalances are depriving deficit countries of jobs. Most of the USA’s trade balance problems are regulatory, and allowing an untaxed imported product to sit next to a taxed USA product.
The USA Federal debt is unlikely a product of trade imbalances – and more likely the inability of the elected official to do the job they were elected to perform. The USA has a fiat currency, manages it like a backed currency – and then refuses to balance revenue against expenditures. Go figure.
Other Economic News this Week:
The Econintersect economic forecast for December 2012 shows weak growth. The underlying dynamics continue to have a downward bent. There are recession markers still in play, and one of our alternate methods to validate our forecast is recessionary. All in all, not a great forecast – but not one which would cause you to jump out the nearest window either.
ECRI believes the recession began in July 2012. ECRI first stated in September 2011 a recession was coming . The size and depth is unknown. The ECRI WLI growth index value is enjoying its fourteenth week in positive territory (but slightly improved from last weeks ten week low). The index is indicating the economy six month from today will be slightly better than it is today.
Current ECRI WLI Growth Index

Initial unemployment claims fell again from 370,000 (reported last week) to 343,000 this week. Historically, claims exceeding 400,000 per week usually occur when employment gains are less than the workforce growth, resulting in an increasing unemployment rate (background here and here).
The real gauge – the 4 week moving average – fell significantly from 408,000 (reported last week) to 381,500. Because of the noise (week-to-week movements from abnormal events AND the backward revisions to previous weeks releases), the 4-week average remains the reliable gauge. This is the highest 4 week average since June 2012.
Weekly Initial Unemployment Claims – 4 Week Average – Seasonally Adjusted – 2010 (blue line), 2011 (red line), 2012 (green line)

Bankruptcies this Week: LifeCare Holdings, Internal Fixation
Data released this week which contained economically intuitive components(forward looking) were:
- Rail movements (where the economic intuitive components indicate a moderatelyslightly expanding economy).
- Imports continue to show the economy is marginally growing
Click here to view the scorecard table below with active hyperlinks.

