Natural gas futures slid in New York for the first time in four days on forecasts of moderating temperatures that would limit demand for electricity generation. Gas declined as much as 2.6 percent as Commodity Weather Group LLC in Bethesda,Maryland, predicted normal weather in most of the eastern half of the U.S. from July 10 through July 19. The high in New York on July 12 may be 84 degrees Fahrenheit (29 Celsius), matching the usual reading, according to AccuWeather Inc.
Natural gas for August delivery fell 8.9 cents, or 2.4 percent, to $3.601 per million British thermal units at 9:20 a.m. on the New York Mercantile Exchange. Trading volume was 7.7 percent below the 100-day average. Prices have climbed 7.5 percent this year and 1 percent this week.

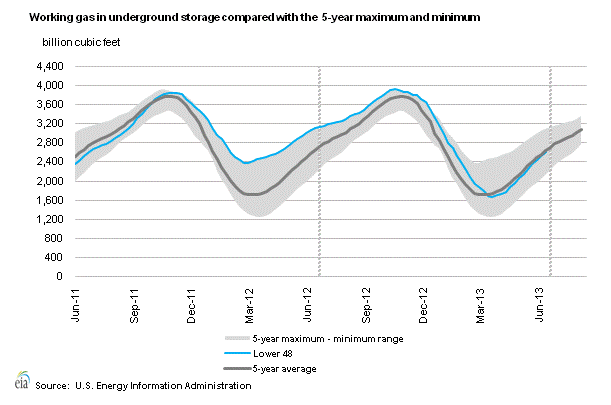
Working gas in storage was 2,605 Bcf as of Friday, June 28, 2013, according to EIA estimates. This represents a net increase of 72 Bcf from the previous week. Stocks were 491 Bcf less than last year at this time and 30 Bcf below the 5-year average of 2,635 Bcf. In the East Region, stocks were 92 Bcf below the 5-year average following net injections of 48 Bcf. Stocks in the Producing Region were 19 Bcf above the 5-year average of 952 Bcf after a net injection of 14 Bcf. Stocks in the West Region were 43 Bcf above the 5-year average after a net addition of 10 Bcf. At 2,605 Bcf, total working gas is within the 5-year historical range.
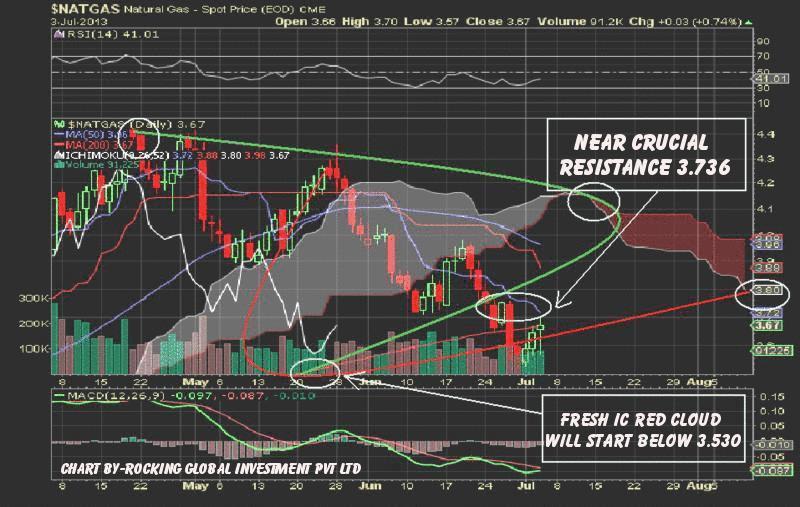
On semiannual technical chart US natural gas creates a format of rising wedge in down trend it indicated that US natural gas short term bearish trend will continue below its near crucial resistance 3.736. You can see more up side level 3.800 and 3.880 if natural gas crosses its crucial resistance 3.736 and close on it. Natural gas new IC red cloud will creates below 3.530. If NG holds on 3.530 then you can see strong short covering next week. Quarterly RSI and MACD also move in negative territory.
- English (UK)
- English (India)
- English (Canada)
- English (Australia)
- English (South Africa)
- English (Philippines)
- English (Nigeria)
- Deutsch
- Español (España)
- Español (México)
- Français
- Italiano
- Nederlands
- Português (Portugal)
- Polski
- Português (Brasil)
- Русский
- Türkçe
- العربية
- Ελληνικά
- Svenska
- Suomi
- עברית
- 日本語
- 한국어
- 简体中文
- 繁體中文
- Bahasa Indonesia
- Bahasa Melayu
- ไทย
- Tiếng Việt
- हिंदी
Is This The Time To Make A Short Position In Natural Gas?
Published 07/05/2013, 12:52 PM
Updated 07/09/2023, 06:32 AM
Is This The Time To Make A Short Position In Natural Gas?
Latest comments
Loading next article…
Install Our App
Risk Disclosure: Trading in financial instruments and/or cryptocurrencies involves high risks including the risk of losing some, or all, of your investment amount, and may not be suitable for all investors. Prices of cryptocurrencies are extremely volatile and may be affected by external factors such as financial, regulatory or political events. Trading on margin increases the financial risks.
Before deciding to trade in financial instrument or cryptocurrencies you should be fully informed of the risks and costs associated with trading the financial markets, carefully consider your investment objectives, level of experience, and risk appetite, and seek professional advice where needed.
Fusion Media would like to remind you that the data contained in this website is not necessarily real-time nor accurate. The data and prices on the website are not necessarily provided by any market or exchange, but may be provided by market makers, and so prices may not be accurate and may differ from the actual price at any given market, meaning prices are indicative and not appropriate for trading purposes. Fusion Media and any provider of the data contained in this website will not accept liability for any loss or damage as a result of your trading, or your reliance on the information contained within this website.
It is prohibited to use, store, reproduce, display, modify, transmit or distribute the data contained in this website without the explicit prior written permission of Fusion Media and/or the data provider. All intellectual property rights are reserved by the providers and/or the exchange providing the data contained in this website.
Fusion Media may be compensated by the advertisers that appear on the website, based on your interaction with the advertisements or advertisers.
© 2007-2025 - Fusion Media Limited. All Rights Reserved.
