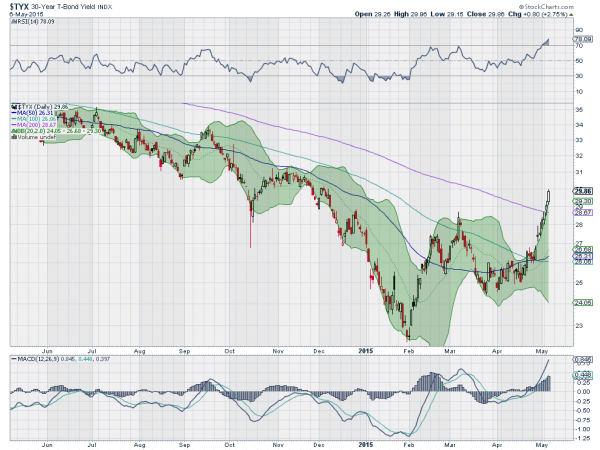
Bond prices have been falling for 7 days in a row. Yields are now knocking at 3% for the first time since December, when they were still falling. The yield has crossed its 200-day SMA for the first time since March 2014. All of this has many asking, like Fred Sanford, if this is the big one.
And it could be. But there are many signs that perhaps yields may pullback, at least for a short time first. The clues are in the chart below.

The first is at the top of the chart. The RSI, a momentum indicator, has moved into overbought territory. It can keep moving higher, getting more overbought, and many stocks do just that. Moving up to 90 or higher. But the RSI for the U.S. 30-year Yield has not been this high since June 2007. It does not like to be overbought.
The candlesticks give another clue. The yield has moved outside of the Bollinger Bands®. This is also something that the Treasury yield has been historically uncomfortable with. It rarely stays outside of the Bollinger Bands for more than 1 day at a time.
A third indication is the actual level itself. The round number of a 3% yield can certainly cause a behavioral reaction and may stall the move higher. Or the prior stickiness at 3.10% close by.
All of these may be ignored of course. Bonds will do what they are going to do. But there seems to be a large crowd amassing on the side of the boat that is looking for the big one, a move much higher in yields. Be cautious if you are one of them.
The information in this blog post represents my own opinions and does not contain a recommendation for any particular security or investment. I or my affiliates may hold positions or other interests in securities mentioned in the Blog, please see my Disclaimer page for my full disclaimer.
