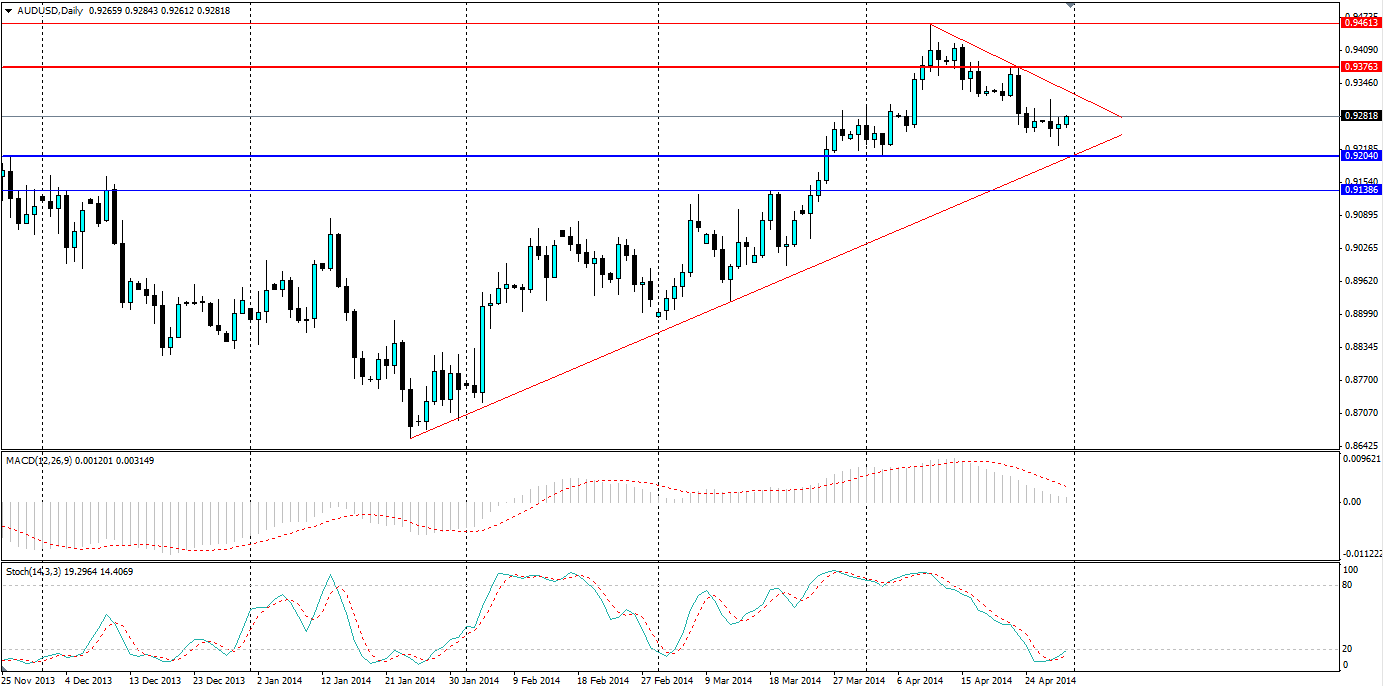
The Aussie dollar hit a 5 month high of 0.94599 against the US dollar on 11th April but has since slid more than 2 cents. Recent economic data points to underlying weakness in the Australian economy, but is there a reason to still be bullish? Technical analysis suggests there might be.
CPI figures released last week showed prices rising by 2.9% on an annual basis. This is up from 2.7% for the December 2013 quarter. Economists had been forecasting a 3.2% increase so this result was a disappointment to them and the market, with the Aussie falling 0.8 cents on the news. The Reserve Bank of Australia has a target of 2-3% inflation so this result is at the upper end of the band.
We can delve a little deeper into this figure to get a sense of the health of the Australian economy by looking at the Non-Tradables inflation. Non-Tradables are goods that are not traded on international markets, such as domestic services or products that have a high transport cost. Price growth of Non-Tradables is slowing down considerably, growing at 3.1% annually to March, down from a high of 4.3% to June 2013.
Australia Non-Tradables 2009-2014

Unemployment surprised the market with a positive result earlier in the month. The market had been expecting 6.0%, in line with last month, however, were delivered 5.8% month on month. This result pushed the exchange rate up to its five month high but it was short lived.
China has an enormous effect on the Aussie Dollar. Exports to China amount to over a quarter of all Australia’s exports (26.2%). The Mining sector is disproportionately reliant on China, with two thirds of exports to China coming from the minerals sector. This means any data out of China is scrutinised by anyone looking for direction on the Australian economy.
Recently, the news out of China has shown a little improvement. The HSBC Manufacturing PMI report showed the recent contraction is slowing with the index at 48.3, up from 48.0 two weeks earlier. GDP figures for the quarter ending in March surprised the market slightly with a year on year figure of 7.4%. This is down from 7.7% at the end of 2013 but the market was expecting 7.3%. Retail sales in China expanded at 12.2% year on year, down from 13.6% but again surprising the market which had expected 12.1%.
HSBC China Manufacturing PMI

Other data from China includes the Money Supply (M2) expanding (only) 12.1%, down from 13.3% and the Value Added of Industry down from 9.7% to 8.8%. The data has been mixed from China in terms of what the market is expecting. It is still very much expanding, albeit slower than in previous periods.
News seems to be a little light going forward for the Aussie. PPI (q/q) seems to be the only major news out, however, next week looks heavy with building approvals, trade balance, unemployment, retail sales and of course the biggest of all, the interest rate target. This will give an indication of where the RBA stands on the interest rate and when (and if) they are looking to begin raising rates. News coming out from China is the Chinese government PMI report and the HSBC report, plus CPI figures in the next two weeks. Data out of the US will no doubt have an impact too with Nonfarm payrolls, GDP figures, Unemployment, Manufacturing PMI and jobless claims. Certainly, there is a lot to watch from China and the USA.
With light news out of Australia this week, technicals will offer insight to movements in the market by looking at the AUDUSD D1 chart. Firstly, we can see that a long term bullish trend is in play, beginning back in January. Secondly, we can see a short term bearish trend in play and the price is converging on both. The price had pulled away from this and peaked on 10th April, beginning a new bearish trend. This could be the market correcting back down to the bullish trend where it will resume, or it may be the beginning of a genuine long term bear trend.
Looking at the stochastic oscillator, we can see this is showing the market is well oversold, indicating the market may continue along the bullish trend. Alternatively, we can look at the MACD indicator and see that the market is still acting with the bullish momentum, albeit slowing due to the recent short term bearish trend. The MACD histogram is heading down towards a crossover, but is not there yet, and combining this with the oversold position of the stochastic indicator, we can conclude the bearish trend is running out of steam and looking to bounce off the bullish trend and head back up.

An interesting pattern is forming on the AUD/USD D1 chart with the convergence of a short term bearish trend with a longer bullish trend. Technicals indicate the short term trend is running out of steam. However, look for the bullish trend to be tested as dynamic support before breaking through the bearish trend. One could even hedge their bets by waiting for either trend to break before following the market higher or lower. The upcoming news out of China and the USA will certainly give the market some direction so traders need to be on the ball.
