The last quarter has been an excellent one for the gold price, particularly thanks to Bernanke and QE Infinity. It has felt as if central bankers and their printing presses are the only things which can affect the gold price. Of course this isn’t true, as we know there are several other underlying fundamentals. Below, Dominic Frisby discusses one of these – supply, and explains how central bankers won’t seem to be the only thing driving the gold price for much longer.
In his essays On The Principles Of Population, the English scholar Thomas Malthus argued that the earth’s resources are limited and cannot support unlimited population growth. “The power of population is indefinitely greater than the power in the earth to produce subsistence for man,” he said.
In many ways "peak oil" theory is an extension of this notion. There is a finite amount of oil in the world, runs the theory (one estimate puts that number at 75 trillion barrels). At a certain stage, the point of maximum production will be reached. Thereafter production levels will decline.
The US reached its peak in 1970; the rest of world, it seems, in May 2005 at 74 million barrels per day – though this is subject to a lot of debate.
But what about "peak gold?" Does the Malthusian argument extend to gold?
Are we really facing "peak gold?"
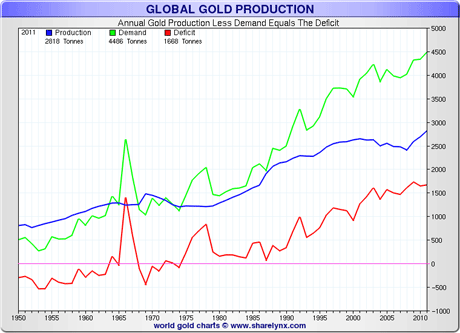
Until last year, it seemed that world gold production had peaked in 2001 at just 2,600 tonnes a year. Despite the rising gold price, by 2008 that number had slid to 2,400 tonnes. However, we have seen a rally, and 2011 saw a record at 2,818 tonnes. Forecasters seem to concur that will we see something like 2,900 tonnes produced in 2012.
However, annual global demand is considerably more than that. It was about 3,500 tonnes in 2000 and rose to 4,486 tonnes by 2011. In other words there is a deficit. There has been a deficit since the mid-1970s. This has risen from below 1,000 tonnes in 2000 to 1,668 tonnes last last year.
The cumulative effect of that deficit is pretty striking. Chartist and all-round data gobbler, Nick Laird of sharelynx.com, who has produced the chart below, says: “Note that since 1950, 133,000 tonnes (over 80% of the gold ever found) has gone into demand with 115,000 tonnes of this having come from production. This leaves a shortfall of 18,000 tonnes, which has come from central bank sales, stockpiles and scrap.”
That 18,000-tonne shortfall represents about seven years’ worth of total production. Where, I can’t help wondering, given that central banks are now net buyers, will the gold to address future shortfalls come from?
It all points to higher prices – prices at which more people are happy to sell.
Miners are having to work harder to find gold
However, the 2011 production record has come at a cost. Exploration expenditure has gone from $1bn in 2000, to $6bn in 2010, according to data from the Metals Economics Group. I’ve read other arguments that suggest the figure is closer to $8bn.
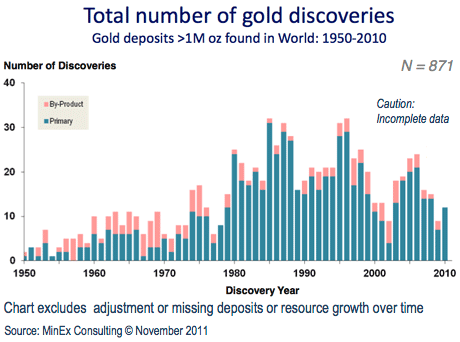
And despite this increased expenditure, the number of major discoveries – for major, read a deposit of more than a million ounces – being made is actually falling, as the table below from Minex Consulting shows.
In 1996 there were about 30. In 2002, around five (with gold as the primary metal). By 2006 that number bounced back to 20. 2010 saw about ten. It seems that number will have fallen in 2011, but the data is still incomplete.
The exploration sector needs to make discoveries to justify its existence. Part of the reason funding dried up in late 2011 and 2012 must be that so few discoveries were made. There was nothing to get investors excited. In fact, failure makes them angry. Shareholders are rather more tolerant of their chief executives lording it up at the Savoy if they’ve just made a million ounce discovery.
As well as the number of discoveries declining, it appears the average size of major deposit discoveries is declining too. In 1970 to 1979, the average was 5.9 million ounces. That declined to 5.6 million ounces in the next decade and to 5.1 million ounces in the decade after that. Between 2000 and 2009, the average size of a major gold discovery fell to 4.4 million ounces. The average grade of discovered gold is also declining – in other words, there is less gold in the rock, which means it is more difficult and more expensive to extract.
In short, we are seeing declines in both size and quality. That’s similar to the problem many oil producers face of having to go into more challenging areas, be it geologically, geographically or politically, to get their oil. It’s a reflection of "peak oil" in other words.
The average time from drilling the discovery hole to declaring the maiden resource is 3.7 years. From discovery to an actual mine start-up, takes an average of ten years. The lack of major recent discoveries points to a further shortfall in production five or ten years down the road. It also suggests that the gap between demand and production will further increase.
So leaving aside the analysis of the subtext of central bank pronouncements, the sheer numbers alone point to higher gold prices ahead.
Please Note: Information published here is provided to aid your thinking and investment decisions, not lead them. You should independently decide the best place for your money, and any investment decision you make is done so at your own risk. Data included here within may already be out of date.
- English (UK)
- English (India)
- English (Canada)
- English (Australia)
- English (South Africa)
- English (Philippines)
- English (Nigeria)
- Deutsch
- Español (España)
- Español (México)
- Français
- Italiano
- Nederlands
- Português (Portugal)
- Polski
- Português (Brasil)
- Русский
- Türkçe
- العربية
- Ελληνικά
- Svenska
- Suomi
- עברית
- 日本語
- 한국어
- 简体中文
- 繁體中文
- Bahasa Indonesia
- Bahasa Melayu
- ไทย
- Tiếng Việt
- हिंदी
Is The World Running Out Of Gold?
Published 09/27/2012, 07:15 AM
Updated 05/14/2017, 06:45 AM
Is The World Running Out Of Gold?
Latest comments
Loading next article…
Install Our App
Risk Disclosure: Trading in financial instruments and/or cryptocurrencies involves high risks including the risk of losing some, or all, of your investment amount, and may not be suitable for all investors. Prices of cryptocurrencies are extremely volatile and may be affected by external factors such as financial, regulatory or political events. Trading on margin increases the financial risks.
Before deciding to trade in financial instrument or cryptocurrencies you should be fully informed of the risks and costs associated with trading the financial markets, carefully consider your investment objectives, level of experience, and risk appetite, and seek professional advice where needed.
Fusion Media would like to remind you that the data contained in this website is not necessarily real-time nor accurate. The data and prices on the website are not necessarily provided by any market or exchange, but may be provided by market makers, and so prices may not be accurate and may differ from the actual price at any given market, meaning prices are indicative and not appropriate for trading purposes. Fusion Media and any provider of the data contained in this website will not accept liability for any loss or damage as a result of your trading, or your reliance on the information contained within this website.
It is prohibited to use, store, reproduce, display, modify, transmit or distribute the data contained in this website without the explicit prior written permission of Fusion Media and/or the data provider. All intellectual property rights are reserved by the providers and/or the exchange providing the data contained in this website.
Fusion Media may be compensated by the advertisers that appear on the website, based on your interaction with the advertisements or advertisers.
© 2007-2025 - Fusion Media Limited. All Rights Reserved.
