Is The USD/SEK–DXY Correlation Broken?

Published 10/07/2019, 12:44 PM
Updated 07/09/2023, 06:31 AM

USD/SEK and DXY often move in the same direction. USD/SEK is frequently used as a proxy for the US Dollar Index for those who don’t have access to trade DXY. As a matter of fact, since mid-June the correlation coefficient on a daily timeframe for the two instruments has been positive (meaning the 2 always move in the same direction) and the lowest reading since that date was +.46. However, today’s price action shows the 2 instruments diverging as the DXY is lower on the day and USD/SEK is higher.
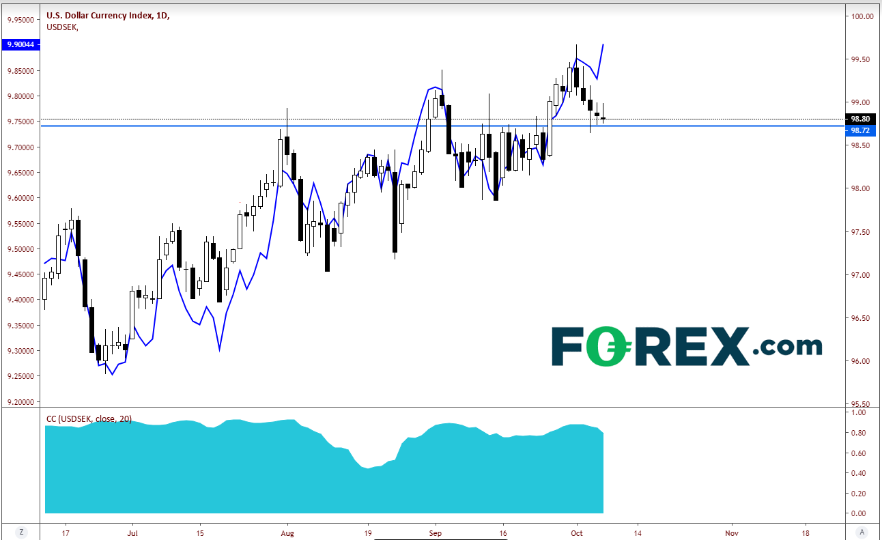
Daily USD/SEK, USD

Source: Tradingview, FOREX.COM

If this correlation is to continue, there needs to be some type of mean reversion in order for the USD/SEK to line up again – so they can move together. Either the USD/SEK has to pull back or the DXY has to move higher, or a little of both.

On the 240-minute timeframe, USD/SEK has broken out of a flag pattern as prices could only pull back to the 38.2% Fibonacci retracement level from the low on September 24 to the highs on October 1. The target of a flag pattern is the distance of the flagpole added to the breakout point of the flag. In this case, the target is near 10.1500. However price doesn’t always move in a straight line and the current candle is putting in an inverted hammer (reversal indication). This may mean price could pull back and test the downward sloping trending of the flag, which is at 9.8756.
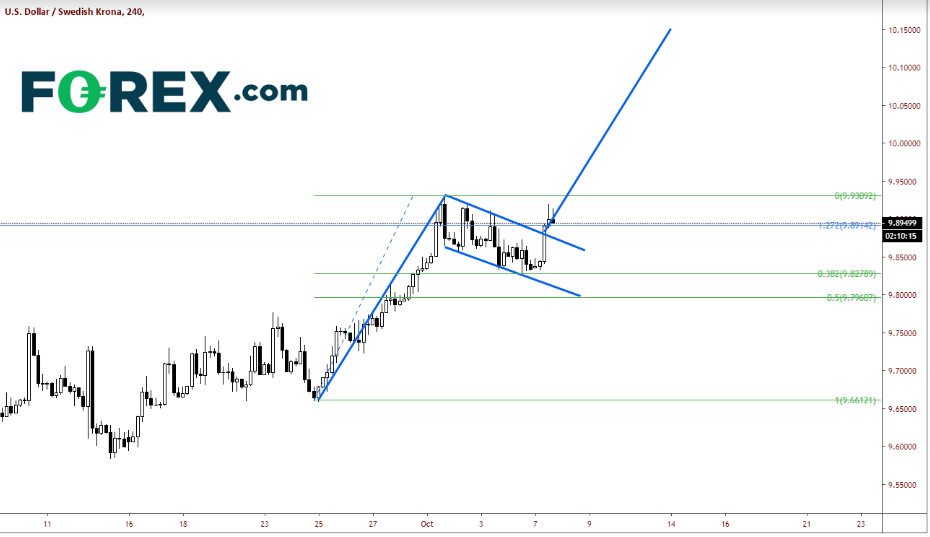
4-Hour USD/SEK

Source: Tradingview, FOREX.COM

As far as DXY is concerned on a 240-minute timeframe, price has pulled back from the recent highs and is currently testing horizontal resistance near 98.74. Ideally, this price should hold and bounce back above the rising trendline toward 99.20 if USD/SEK is going to continue higher.
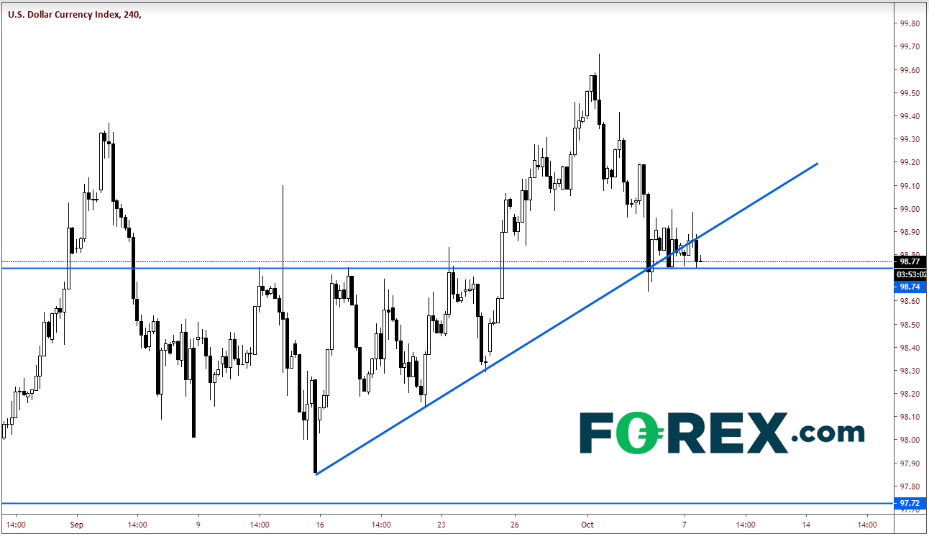
4-Hour USD

Source: Tradingview, FOREX.COM

If DXY moves below 98.64, there is room for the USD to run lower. If the correlation remains intact, USD/SEK will have to pull back into the flag formation (with a false breakout) and test the bottom trendline of the flag pattern near 9.8115.

Latest comments

Loading next article…
Risk Disclosure: Trading in financial instruments and/or cryptocurrencies involves high risks including the risk of losing some, or all, of your investment amount, and may not be suitable for all investors. Prices of cryptocurrencies are extremely volatile and may be affected by external factors such as financial, regulatory or political events. Trading on margin increases the financial risks.
Before deciding to trade in financial instrument or cryptocurrencies you should be fully informed of the risks and costs associated with trading the financial markets, carefully consider your investment objectives, level of experience, and risk appetite, and seek professional advice where needed.
Fusion Media would like to remind you that the data contained in this website is not necessarily real-time nor accurate. The data and prices on the website are not necessarily provided by any market or exchange, but may be provided by market makers, and so prices may not be accurate and may differ from the actual price at any given market, meaning prices are indicative and not appropriate for trading purposes. Fusion Media and any provider of the data contained in this website will not accept liability for any loss or damage as a result of your trading, or your reliance on the information contained within this website.
It is prohibited to use, store, reproduce, display, modify, transmit or distribute the data contained in this website without the explicit prior written permission of Fusion Media and/or the data provider. All intellectual property rights are reserved by the providers and/or the exchange providing the data contained in this website.
Fusion Media may be compensated by the advertisers that appear on the website, based on your interaction with the advertisements or advertisers.
© 2007-2025 - Fusion Media Limited. All Rights Reserved.