Key Points:
- Long-term bearish channel still in place.
- Recent bullish sentiment already beginning to evaporate.
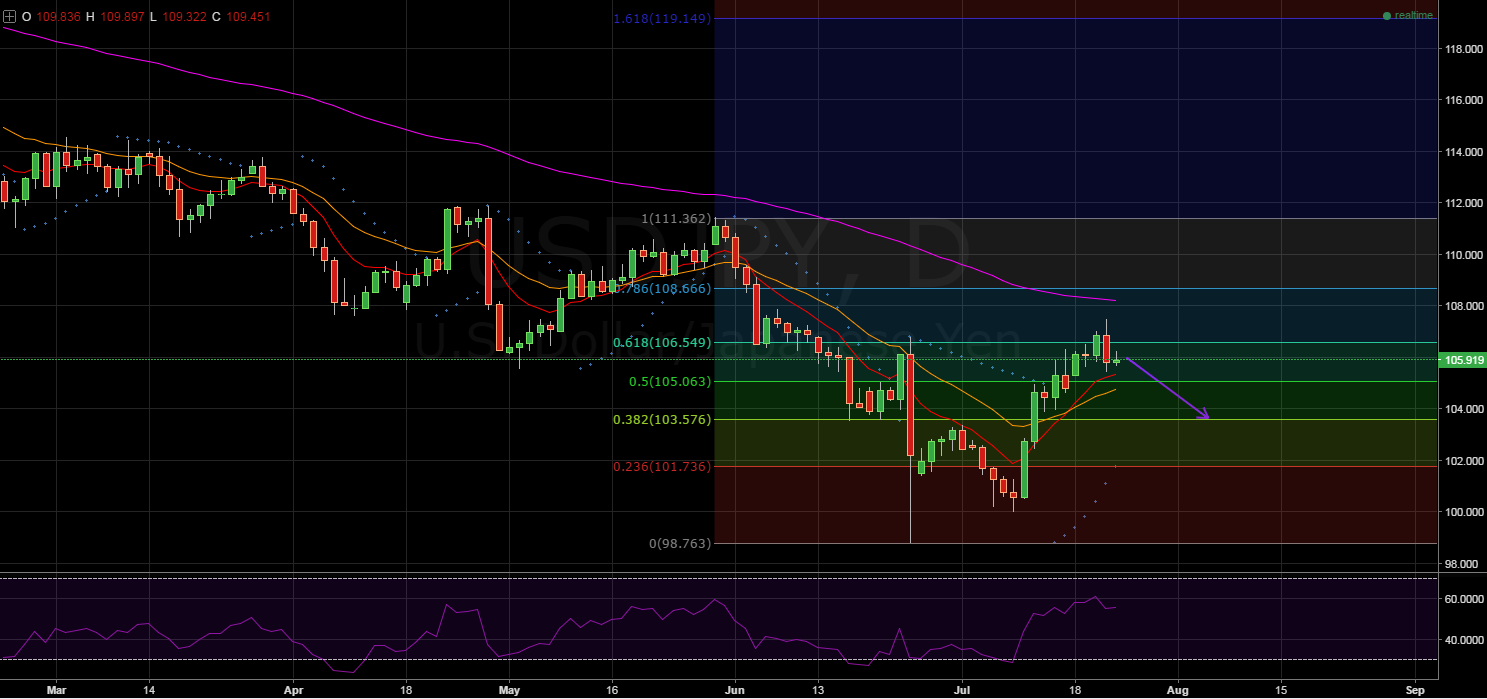
- Retracement to the 38.2% Fibonacci level looking likely.
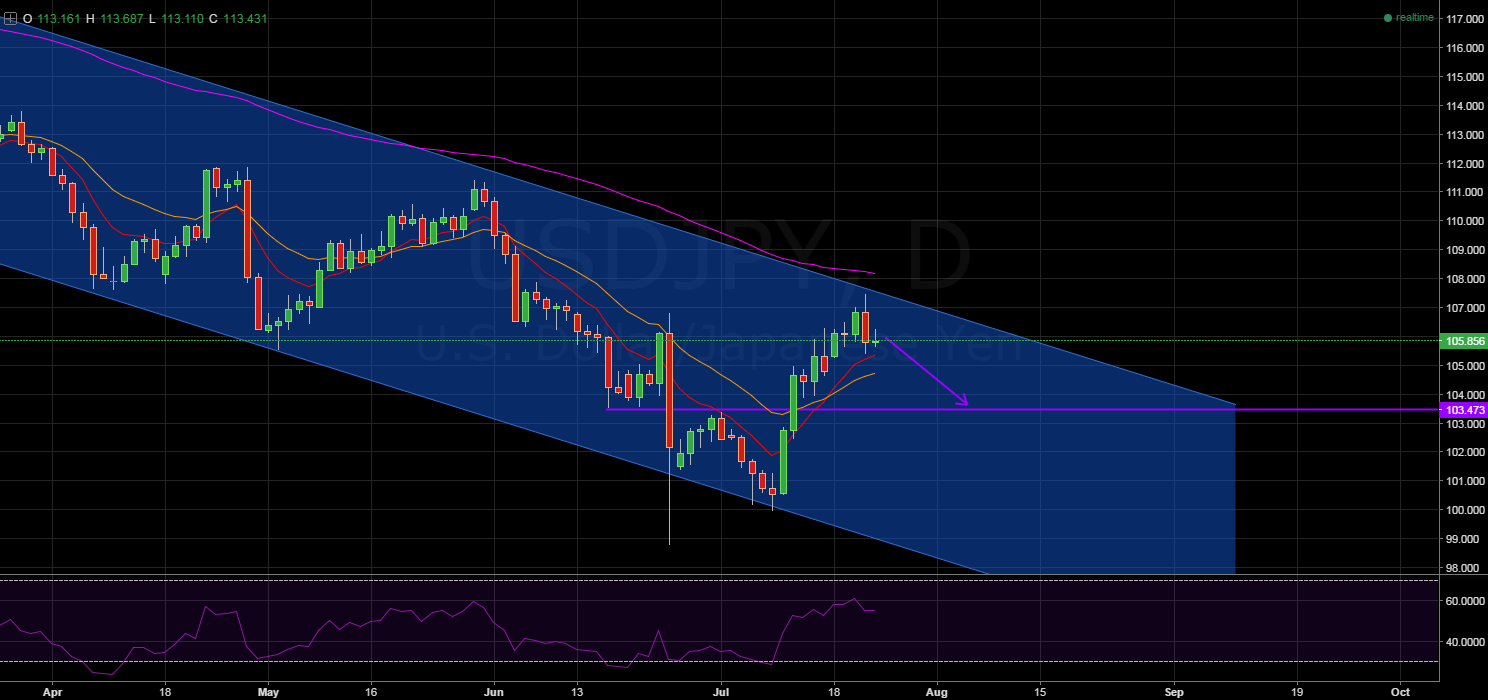
Much to the relief of the Bank of Japan, the USD/JPY has been staging a relatively impressive recovery over the past week or so. Specifically, recent bullishness has brought the pair into contact with the upside constraint of the long term bearish channel.
As a result, eyes are now firmly fixed on the yen as a breakout here could spell the end of the relentless downtrend. However, the technicals are currently signalling that disappointment could be on the cards for those hoping for further bullishness.
First and foremost, the continuation of the bearish trend is highly probable given the presence of not only the long-term channel, but also the bearish 100 day EMA. As has been outlined before, the pair has remained within the channel structure for a significant period of time.
Additionally, the upside constraint has been well tested and has proven to be an implacable obstacle to any long-term shift in momentum. A degree of this stiff resistance has, of course, been the result of the dynamic resistance supplied by the tenaciously bearish 100 day EMA which hasn’t relented since it originally took a downturn last December.

Whilst the 100 day EMA remains firmly bearish, a recent bullish crossover of the 12 and 20 day EMA’s has given a glimmer of hope to those hoping for an upside breakout.
However, as has been seen multiple times recently, these crossovers simply lack the momentum to see the channel broken. In fact, the most recent run at breaking free appears to have already been defeated.
This being said, when combined with the currently bullish Parabolic SAR readings, the USD/JPY could conceivably make another attempt at breaking resistance whilst positions are unwound as the week comes to an end.

Whilst not shown, on the H4 chart there is also some evidence pointing to a possible divergence occurring which could be signalling that another surge lower is imminent. What’s more, there is little in the way of support being supplied by the relative neutrality of the H4 and daily RSI oscillators.
Consequently, there remains significant scope for a sizable slip in the coming days which could take the pair all the way back to the 100.00 handle. However, there will likely be some solid support found at the 38.2% Fibonacci level which could stall the tumble to a degree.
Ultimately, the relative lack of pertinent fundamental result releases due by the end of the trading week should leave the USD/JPY somewhat beholden to the aforementioned technical manoeuvres.
However, the US Markit Flash Manufacturing PMI result is due which could see a small surge in USD sentiment as the week ends. Just as easily however, a weaker outcome could kick start the highly probable tumble back to support.
