The USDJPY (FXY) has been the talk of the town as of late. Soros pulled in over $1bn in profits, Kyle Bass has been all over it from the beginning, I'm sure it's making up for a lot of the losses on Apple (AAPL) in the hedge fund world. I've managed to make a bit of money in the trade a few weeks ago, but have largely missed the move thus far. The question is how more run does this trade have?
The chart for the USD/JPY recently formed a head and shoulders chart pattern, which is thought to be a bearish sign.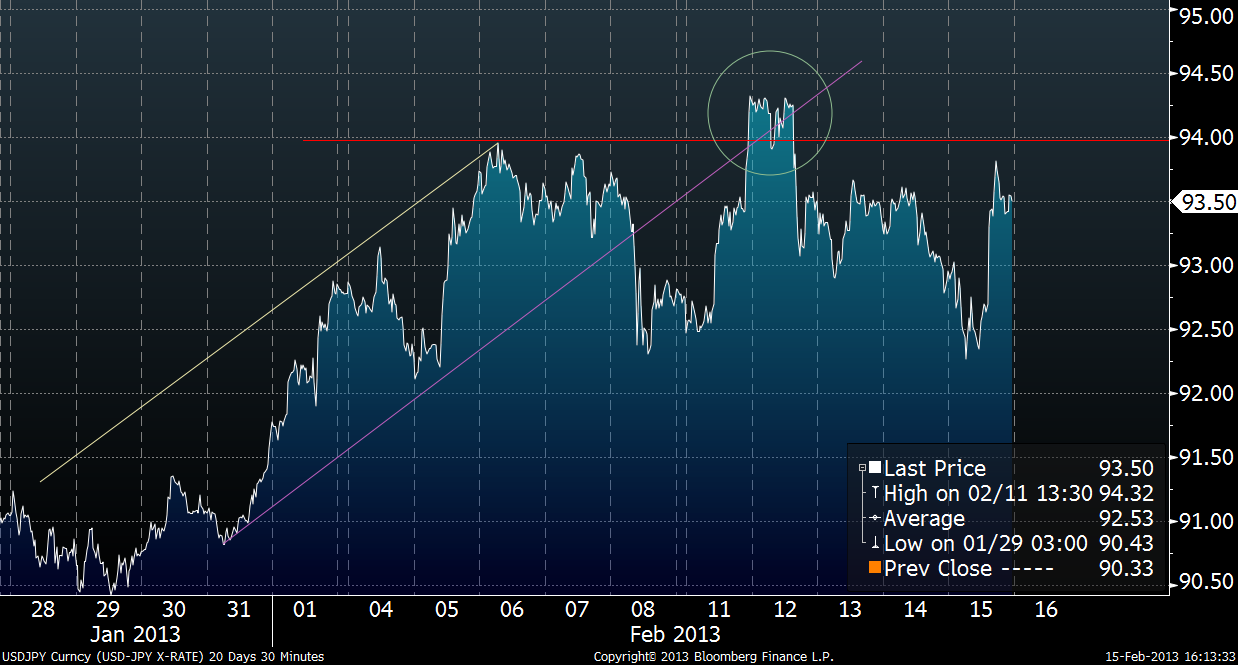
I'm not a technical trader, but in my view it is worth being aware of technicals, as they become self-fulfilling prophecies. There are enough technicians on trading floors around the world that if an obvious technical level or pattern shows up in a chart, whether there is any fundamental reason or not for a price level, the technicians money flowing into the position causes the technical indicator to ring true. This turns into a self-reinforcing feedback loop, which is why there are so many technical traders around the world today.
With an average holding period of 5 days, I'm mainly trade slightly longer term swings in currencies that brings more fundamentals into play, as they will ultimately drive longer term trends. Of these indicators, I use both macroeconomic data as well as market based data. Of the market based indicators, I've found the FX Options market price action being some of the most informative. The FX Option markets is dominated by hedge funds, investment banks and other professional traders, so it is often a good indicator of where the "smart money" is at.
The FX Option Market's Take on USDJPY
In the FX Option market, I look at option volatility prices and risk reversal prices.
The option volatility prices is an indicator of demand, thus the higher the option volatility, the higher the price of the options. Given my trading time frame, I keep an eye on the 1 month option volatility. The higher the volatility, the more interest in options 1 month out, the more potential for a move either to the upside or downside.
The risk reversal prices are the price of calls versus puts at a given level of delta. Without getting too deep into derivatives, essentially what this indicator shows is whether call options or put options are being bought up in greater quantity. Mathematically, it is the price of a call option at 25 delta minus the price of put option at 25 delta. Therefore, if the number is positive, calls are more expensive than puts, if it is negative, puts are more expensive than calls.
Between the option volatility and the risk reversal prices, you get a clear picture of what the pros are setting up for.
Below is a chart with the 1 month USDJPY price (blue shaded section), the 1 month option volatility (yellow line), the 3 month option volatility (red line) and the 1 month risk reversal (purple line):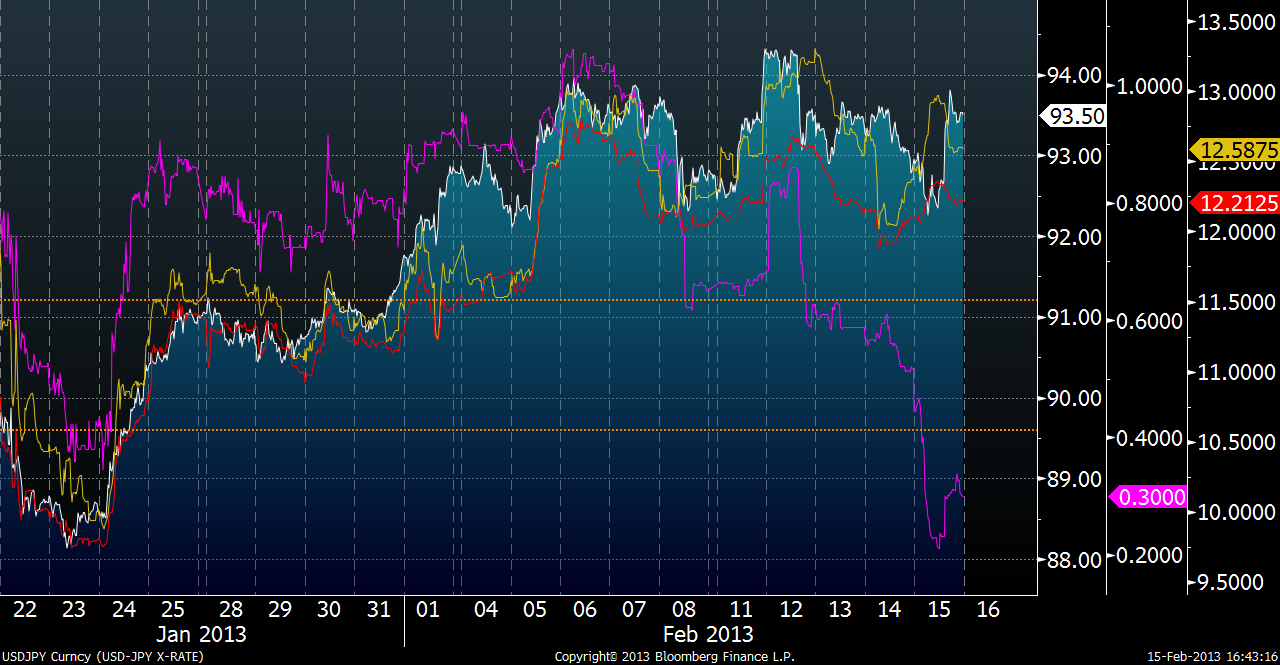
As you can see option volatility has been increasing steadily over the past month, indicating more options being bought and sold, and in the past week, the amount of puts being purchased as increased dramatically. This could be driven by traders protecting gains with the purchase of puts, or speculation that the currency will fall. Either way, the smart money, consistent with the head and shoulders pattern, is setup also setting up for a fall in the USD/JPY (a strengthening of the Yen).
On the 6 month chart this becomes even more apparent, with option volatility growing exponentially and risk reversals hitting their lowest point in the past 6 months: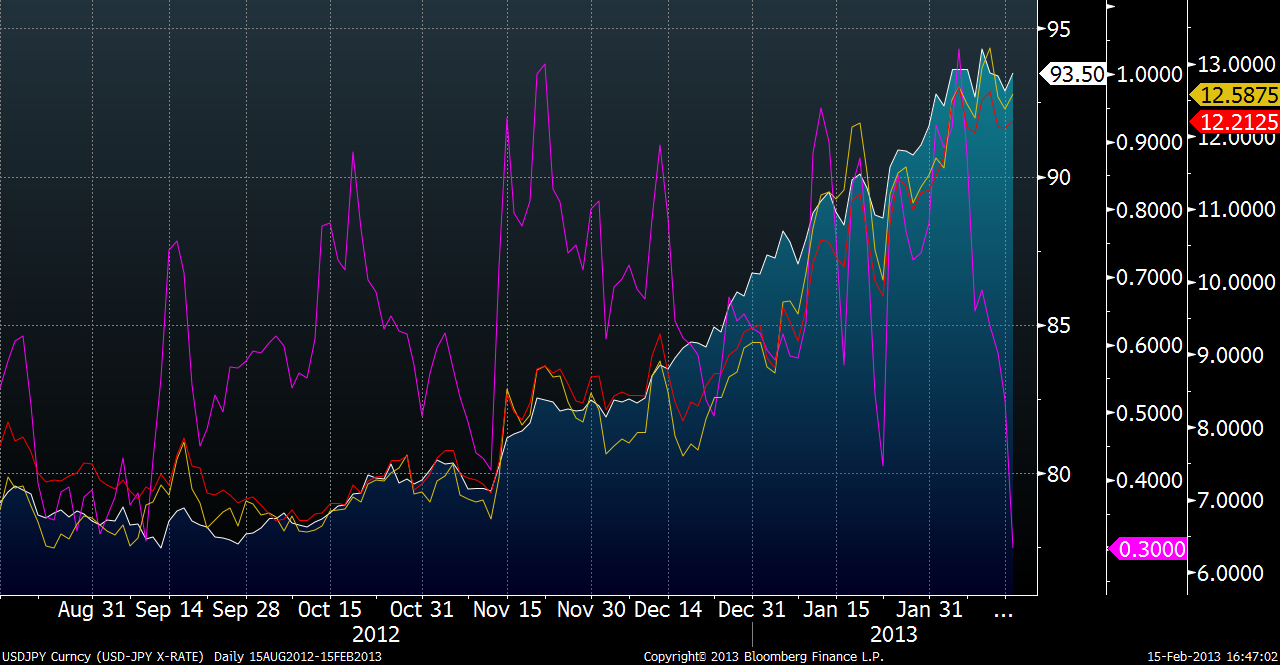
Finally, on the 1 year chart, the risk reversals price is shown to be touching levels not seen since last September, but at the same time it is worth noting that they haven't touched levels seen in the summer of 2011, which was the last time the USD/JPY rallied to the mid 80s range and subsequently sold off back to the mid 70s range.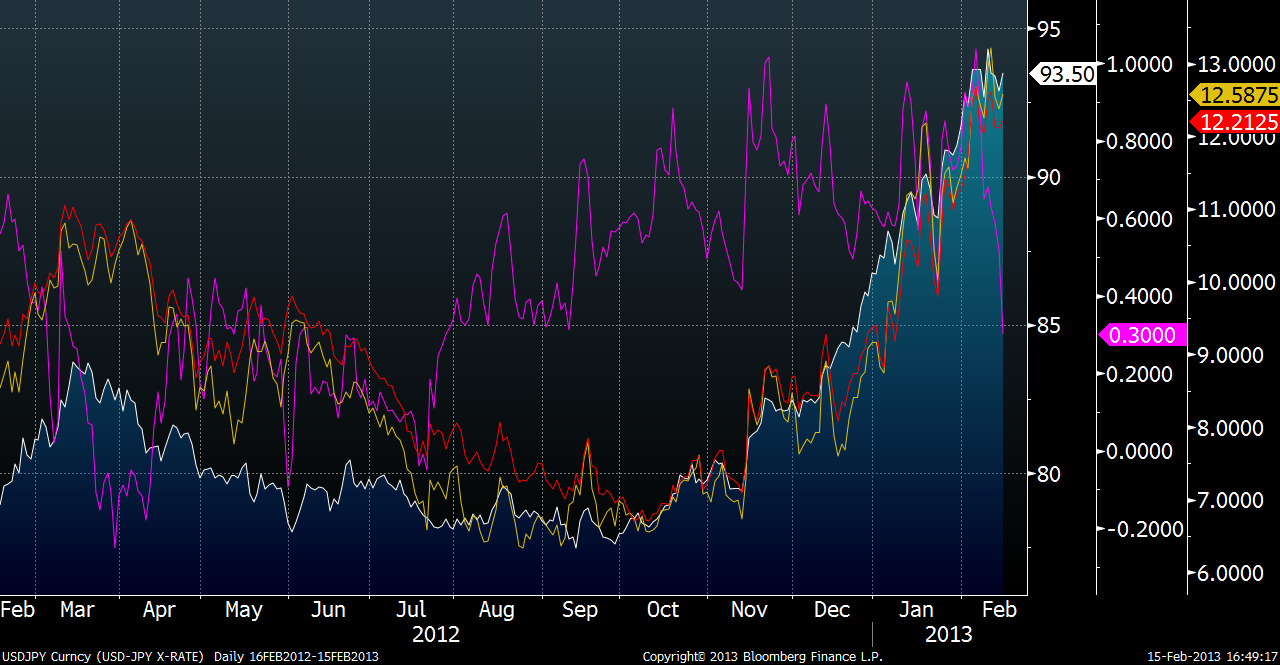
The Bank of Japan
The Bank of Japan (BOJ) has seen its assets grow substantially along with the rise in the USDJPY, but this isn't a new trend. Below is a 20 year chart, a 1 year chart and a 6 month chart of the BOJ Balance Sheet Assets (blue shaded region) with the USD/JPY exchange rate (yellow line):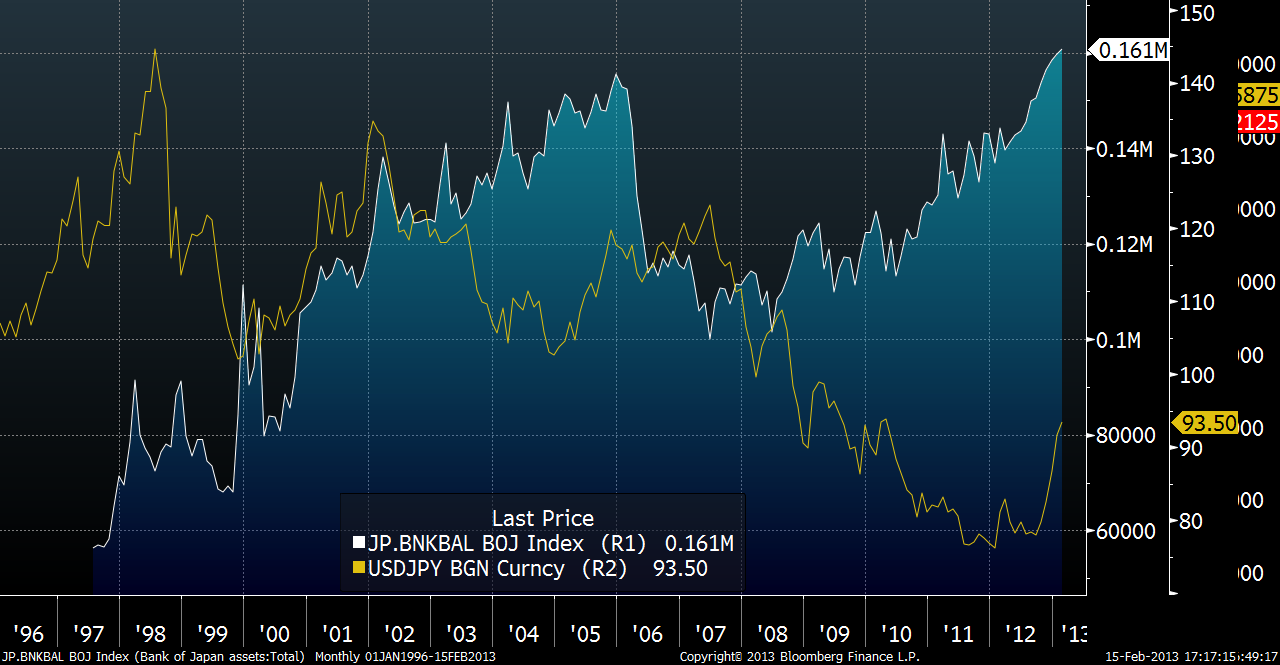
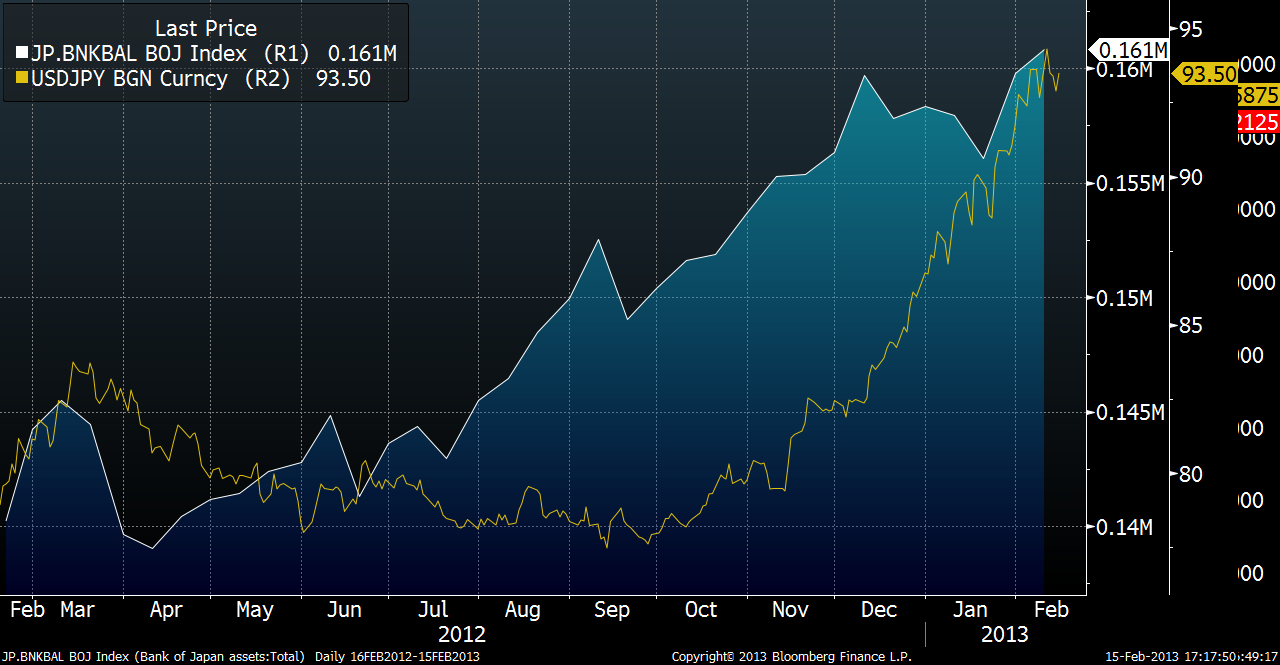
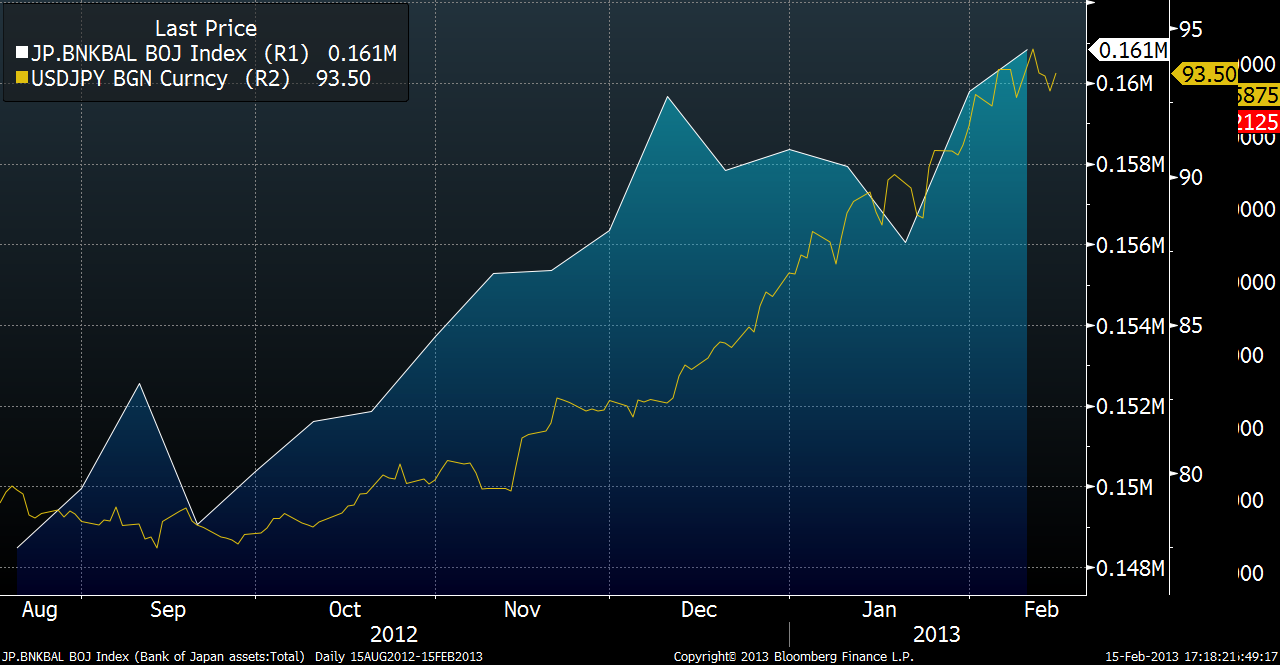
Most interestingly is that in a long term sense, the BOJ has had assets at this level before back in March of 2006. As aggressive as the recent buying may seem, by all appearances the BOJ has a long way to go before they are in completely uncharted waters. Therefore, I don't see them as being gun shy at this point.
What I find most compelling about the BOJ story is that they are not targeting an FX exchange rate, as the BOJ Governor Masaaki Shirakawa pointed out this past Thursday, but rather an inflation rate. Without commenting on the wisdom of this move, this makes the USDJPY extreme exchange rate move a largely moot point in the BOJ's eyes, as they are dedicated to the 2% inflation target. Not only does this rhetoric make this politically possible on the world stage, but it suggests that until the inflation rate in Japan reaches the 2% number, the USDJPY has plenty of room to move.
The Retail Traders
The last indicator, and one of my favorites, is retailer trader positions, what I call my "Pauly Michaels Indicator". The sad fact is that 80% of retail FOREX traders lose money, therefore being on the other side of their trade is often a wise move. OANDA, my broker and a first class operator, publishes their book in real time allowing you to see the sentiment in the retail market.
Below are charts from OANDA's historical position ratios. I've broken out 1 year, 1 month and 1 week charts, with the blue indicating a net long position, orange indicating a net short, and the black line being the USDJPY exchange rate.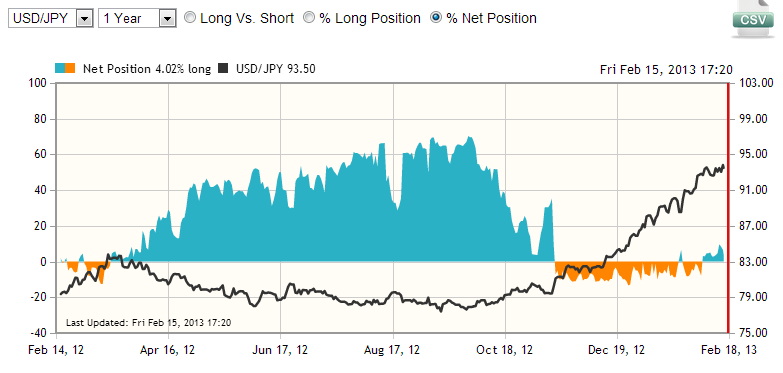
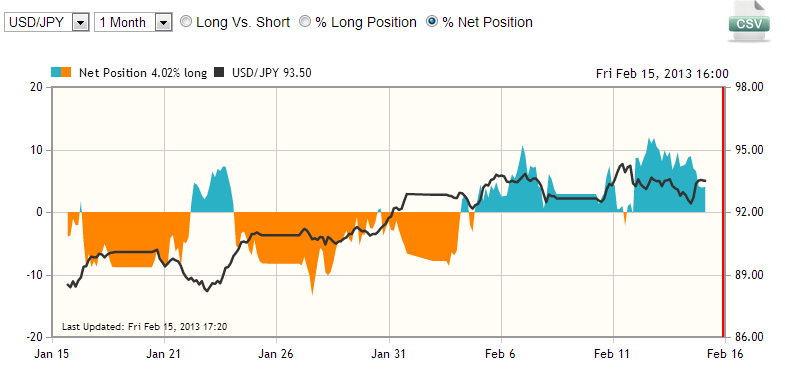
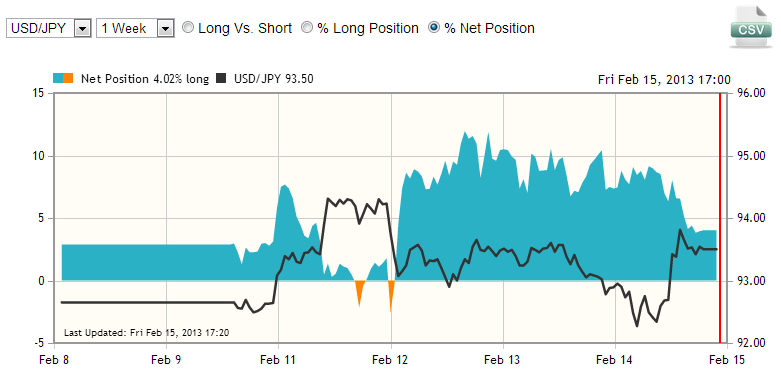
These three charts demonstrate the power of this tool. Looking at the 1 year chart (the top chart), you see all through 2012 retail traders were extremely bullish on the Yen as it trended down to 75. Then, during its recent rally, the one I presume they were all been waiting for, rather than profiting from the massive upswing that they had been waiting for all year, the retail traders go net short, missing out on the move from 83 to 94, while Soros picked up his 1 billion. That is what separates the pros from the amateurs.
Looking at the USDJPY trade now, I find it concerning that the retail side of the trade has moved to a net long position, but encouraging that it is not nearly the ratio is was throughout 2012. Also, in with retail traders selling off their position in the past week, I see this as a good sign as now being potentially a good time for an entry point.
The Bottom Line and the Trade
I`ve been long the USD/JPY since February 13th, and am essentially at break even in the position thus far. After conducting this analysis, I`m slightly more concerned for the downside, especially seeing as how the FX Option market has moved, but at the same time find it encouraging the retail traders have sold off this past week.
The overriding factor is the BOJ`s inflation target. As long as that is the BOJ`s main focus, I don`t see USDJPY at 94 being the top end for the move, despite the technicals and the positioning in the retail and FX options markets. The fact that the BOJ has had their balance sheet at this level of assets before is also encouraging, as they`ll be much less hesitant to expand it further given this historical context. Of course, there is a point where the BOJ will be hesitant in expanding the balance sheet further, but we haven`t hit that yet.
In conclusion, depending on the open Sunday afternoon (the open of the FOREX market in Vancouver, British Columbia, Canada), I may exit my USD/JPY position, as this head and shoulders may be legit. With retail traders becoming more bullish, and the smart money largely going negative, this doesn't appear to be the best entry point. That being said, long term, I don't see 94 being the top end, and will likely buy back in when conditions are more favorable.
- English (UK)
- English (India)
- English (Canada)
- English (Australia)
- English (South Africa)
- English (Philippines)
- English (Nigeria)
- Deutsch
- Español (España)
- Español (México)
- Français
- Italiano
- Nederlands
- Português (Portugal)
- Polski
- Português (Brasil)
- Русский
- Türkçe
- العربية
- Ελληνικά
- Svenska
- Suomi
- עברית
- 日本語
- 한국어
- 简体中文
- 繁體中文
- Bahasa Indonesia
- Bahasa Melayu
- ไทย
- Tiếng Việt
- हिंदी
Is The USD/JPY Head And Shoulders Pattern Legit?
Published 02/16/2013, 02:12 AM
Updated 07/09/2023, 06:31 AM
Is The USD/JPY Head And Shoulders Pattern Legit?
Latest comments
Loading next article…
Install Our App
Risk Disclosure: Trading in financial instruments and/or cryptocurrencies involves high risks including the risk of losing some, or all, of your investment amount, and may not be suitable for all investors. Prices of cryptocurrencies are extremely volatile and may be affected by external factors such as financial, regulatory or political events. Trading on margin increases the financial risks.
Before deciding to trade in financial instrument or cryptocurrencies you should be fully informed of the risks and costs associated with trading the financial markets, carefully consider your investment objectives, level of experience, and risk appetite, and seek professional advice where needed.
Fusion Media would like to remind you that the data contained in this website is not necessarily real-time nor accurate. The data and prices on the website are not necessarily provided by any market or exchange, but may be provided by market makers, and so prices may not be accurate and may differ from the actual price at any given market, meaning prices are indicative and not appropriate for trading purposes. Fusion Media and any provider of the data contained in this website will not accept liability for any loss or damage as a result of your trading, or your reliance on the information contained within this website.
It is prohibited to use, store, reproduce, display, modify, transmit or distribute the data contained in this website without the explicit prior written permission of Fusion Media and/or the data provider. All intellectual property rights are reserved by the providers and/or the exchange providing the data contained in this website.
Fusion Media may be compensated by the advertisers that appear on the website, based on your interaction with the advertisements or advertisers.
© 2007-2024 - Fusion Media Limited. All Rights Reserved.