Social safety nets are government or non-government (NGO) social programs to assist those in society who cannot work (or cannot work to full capacity). Many worry that such programs are incentives for people not to work IF they can get covered by a social safety net.
Follow up:
Americans generally view social programs as anti-capitalistic (and try to limit applicability) - and view Europe, Canada and Australia as more socialistic. Using this logic, one would think that a higher percentage of Americans would need to work (as American's are not savers and see themselves as capitalistic) than other advanced economies.
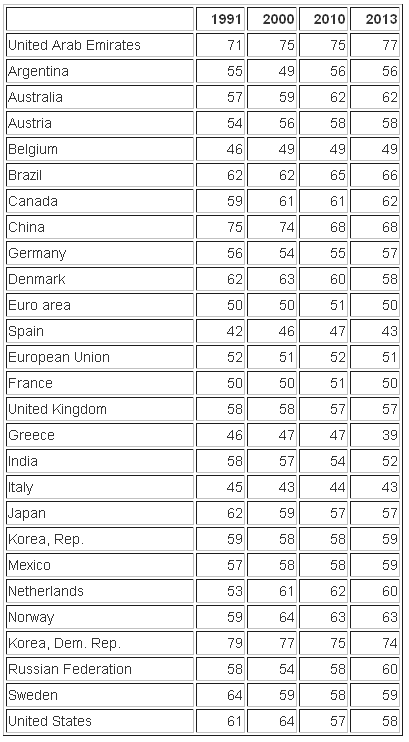
In some cases, a higher proportion of Americans work than other advanced economies. But it is not generally true.
Employment to population ratio, 15+, total (%) (modeled ILO estimate)

Note on above chart: Employment to population ratio is the proportion of a country's population that is employed. Ages 15 and older are generally considered the working-age population. International Labour Organization, Key Indicators of the Labour Market database.
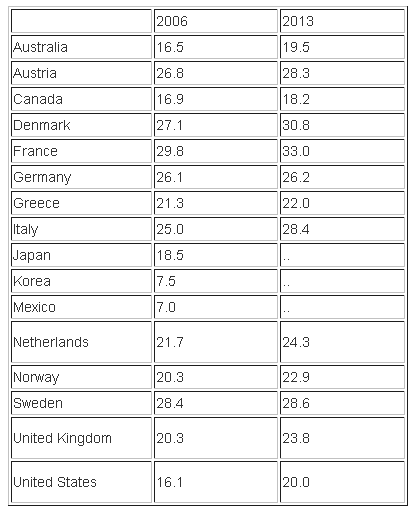
What is true is that American's generally spend less on social safety nets than other advanced economies.
Total public social expenditure as a percentage of GDP

What we can also say is true is that there seems to be no direct correlation between social safety net spending and employment (Italy and France might be exceptions if one were cherry picking high social safety net spending and low employment). In general, most advanced economies spend more on social safety nets and have similar employment levels.
Basically this post is sharing information. There is difficulty when one tries to compare data between countries as data gathering is different and equalizing the results involve a certain "rough justice". It is just hard to get over the feeling that some would take advantage the option of being paid in lieu of working.
But my real thoughts this week are around my theme for 2015 -Hello 2015! What Do You Have In Store for Us? In that post, I worried about currency wars effecting the business cycle. Currency wars are attempts by central banks to change the relative value of their currency using artificial means. There are two problems for the globalized business world:
- Although change is good - unanticipated change is disruptive in the short term - and always leads to dislocation and stunting of cycle growth while resources are reallocated. The larger the change, the greater the disruption;
- Central Bankers are engaging in long term actions. While short term actions can soften the effects of cycles - long term actions create unintended imbalances which eventually must correct. This past week, Switzerland bailed out of their artificial currency peg. The vaporization of assets could be heard around the world.
If the Swiss footprint is relatively small in size - it is not small in reach - touching most parts of Europe (especially Swiss denominated debt). Contagion is the problem here as it will not take much to take southern Europe over the edge.
The heat is rising. and I no longer would bet against a currency war spillover into the USA business cycle. Could this be the straw that breaks the back of the US stock market advance?
Other Economic News this Week:
The Econintersect Economic Index for January 2015 is showing our index is midrange in a tight growth range for almost a year. Although there are no warning flags in the data which is used to compile our forecast, there also is no signs that the rate of economic growth will improve. Additionally there are no warning signs in other leading indices that the economy is stalling - EXCEPT ECRI's Weekly Leading Index which is slightly below the zero growth line. There have been some soft data points which caused our index to decline this month - but as the individual rolling averages are not declining, we must assume it is simply a bad data month.
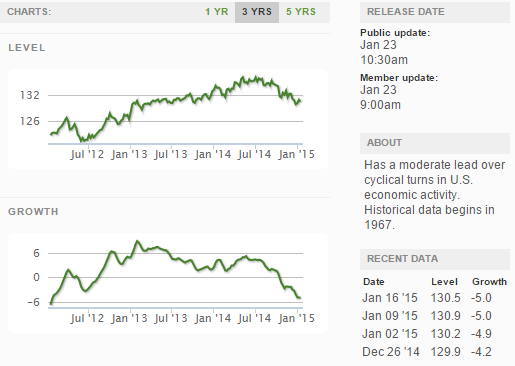
The ECRI WLI growth index value crossed slightly into negative territory which implies the economy will not have grown six months from today.
Current ECRI WLI Growth Index
The market was expecting the weekly initial unemployment claims at 289,000 to 305,000 (consensus 300,000) vs the 307,000 reported. The more important (because of the volatility in the weekly reported claims and seasonality errors in adjusting the data) 4 week moving average moved from 300,000 (reported last week as 298,000) to 306,500. The rolling averages had been equal or under 300,000 for the previous 18 weeks.
Weekly Initial Unemployment Claims - 4 Week Average - Seasonally Adjusted - 2011 (red line), 2012 (green line), 2013 (blue line), 2014 (orange line), 2015 (violet line)
Bankruptcies this Week: Wet Seal, Hipcricket
Click here to view the scorecard table below with active hyperlinks
Weekly Economic Release Scorecard:


