The economy appears to be decelerating. Consider that the advance estimate 4Q2013 GDP was 3.2% growth while GDP growth in the previous quarter (3Q2013) was 4.1%. Currently the headlines of components used to compile 1Q2014 GDP are not pretty.
I am not a lover of GDP to measure economic activity at the Main Street level.
Although one can understand that imports export the money from the economy which could be multiplied – it fails to recognize at least the first spending by business and consumers as adding to the economy – and loses measuring this activity.
Secondly, this inventory component (GDP measures production and credits inventory levels in GDP) – this creates a wobble or noise – and creates a situation where the start of recessions are not easy to identify (inventory buildups are a canary for recession starts).
Figure 1 – Consumption Based GDP [crediting imports, crediting only the deltas in inventory, and not adjusting for inflation](blue line) and Seasonally Adjusted Headline GDP [unadjusted for inflation] (red line)
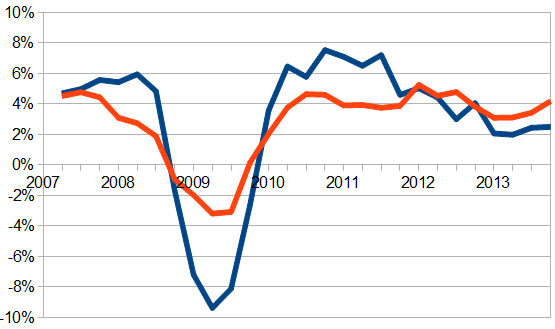
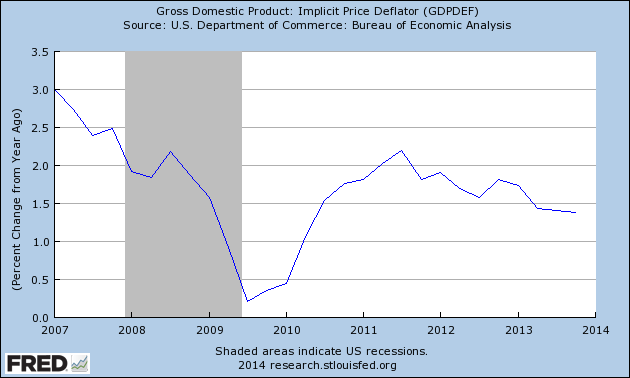
GDP was seen as strengthening in the last half of 2013. However, the real strengthening at Main Street level was significantly less than the headlines would suggest. Further, if one adjusts for inflation – the Main Street economy is growing a little above 1% (subtracting the GDP deflator in figure 2 from the values in figure 1).
Figure 2 – GDP Inflation Deflator
Headline GDP is annualized quarter data – not year-over-year data (figure 1 uses year-over-year). So if there are anomalies in the seasonal adjustment methodology – this headline measurement is flawed. [Note that the BEA does not publicly release unadjusted GDP data.] I fear there are so many failure points in the way GDP is determined, that one cannot take the GDP data as accurate. Further, consider that the New Normal nuances have not settled down. The economic data showed weakness in the first part of 2013, and an even larger weakness is now beginning to appear in 2014. One wonders how seasonal adjustment is adjusting for this effect?
Currently there is an overall deceleration in the data despite consensus economic predictions the economy would strengthen entering 2014.
As I prefer non-monetary measures to quantify the economy, my economic canary is rail transport railcar counts. Rail moves materials which usually do not show up in GDP until the next quarter – and rail is not having a strong start in 2014. The weekly data is fairly noisy, and the best way to view it is to look at the rolling averages:
Table 3 – Rail Rolling Averages
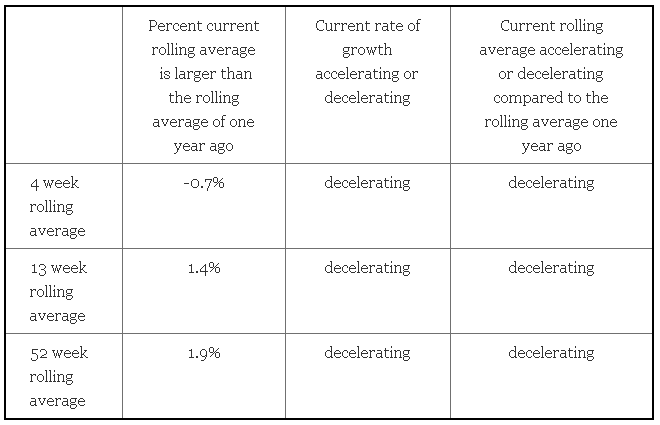
Figure 4 – Current Rail Chart
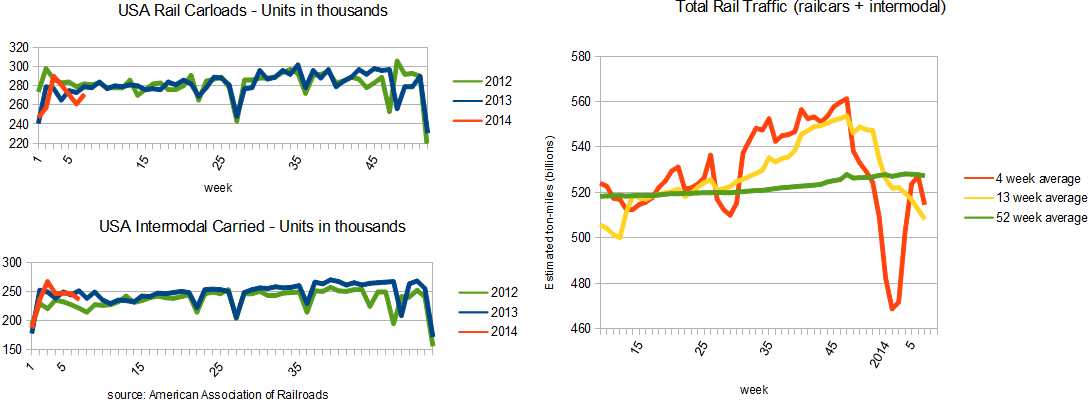
At this point there is no way to determine if there is a weather component affecting the rail traffic. If the unusually severe winter weather for the eastern half of the country has merely slowed traffic then March, and certainly by April, should see stringer rail numbers as businesses play catch up. If March and April Rail traffic remains weak this will reflect a slower economy.
Rail data has essentially has no backward revision. The government compiled economic data can and does have significant backward revision. What I am discussing in this article is true only to the extent the data is good. The USA has no real time data gathering, and private industry would not tolerate an absence of accurate real time feedback.
Backward revision of data is not acceptable if you are trying to run an economy based on this information.
Other Economic News this Week:
The Econintersect economic forecast for February 2014 continues to confirm a moderately improving economy without the roller coaster effect seen from the end of the Great Recession to mid 2013. Is this suggesting 2014 will be a good year? – This remains to be seen.
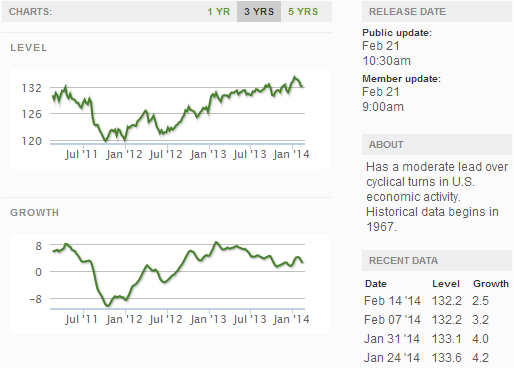
The ECRI WLI growth index value has been weakly in positive territory for over four months – but in a noticeable improvement trend. The index is indicating the economy six month from today will be slightly better than it is today.
Current ECRI WLI Growth Index
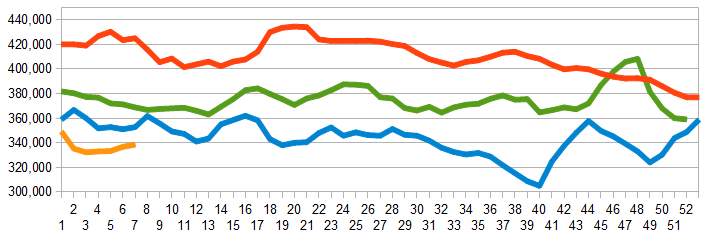
Initial unemployment claims went from 339,000 (reported last week) to 336,000 this week. Historically, claims exceeding 400,000 per week usually occur when employment gains are less than the workforce growth, resulting in an increasing unemployment rate. The real gauge – the 4 week moving average – marginally worsened from 336,750 (reported last week) to 338,500. Because of the noise (week-to-week movements from abnormal events AND the backward revisions to previous weeks releases), the 4-week average remains the reliable gauge.
Weekly Initial Unemployment Claims – 4 Week Average – Seasonally Adjusted – 2011 (red line), 2012 (green line), 2013 (blue line), 2014 (orange line)
Bankruptcies this Week: Lexico Resources International, First Mariner Bancorp, Cereplast, Optim Energy, Event Rentals
Weekly Economic Release Scorecard:
Click here to view the scorecard table below with active hyperlinks


