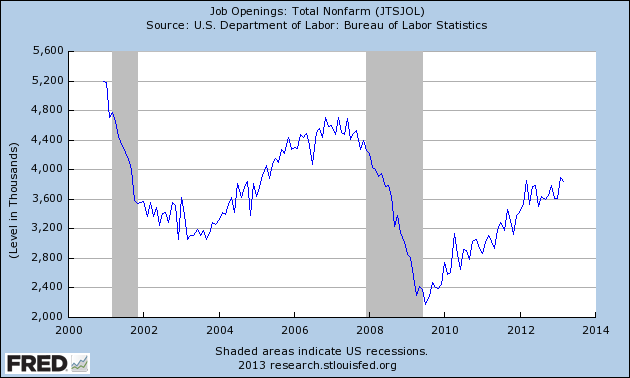
The difficulty filling positions that some employers are already experiencing can be seen in the rising number of unfilled job openings at the end of each month. The latest BLS survey reveals that there were 3,844,000 job openings at the end of March, virtually unchanged from the 3,899,000 openings still available at the end April. Again, significant monthly fluctuations notwithstanding, the number of job openings at the end of each month has been steadily increasing since mid-2009. - Challenger Gray & Christmas
Here is the Jobs Openings and Labor Turnover (JOLTS) data from the BLS which Challenger was referring.
Challenger continued:
As the number of job openings rises and the number of unemployed falls, the number of available workers per job opening continues to shrink.
Is headline unemployment a measure of labor slack? Most know my position is that headline unemployment (U-3), or even the all in unemployment (U-6) do not properly measure the potential workforce. Still, the U-6 unemployment rate does provide a broad understanding of labor force slack as it includes people who: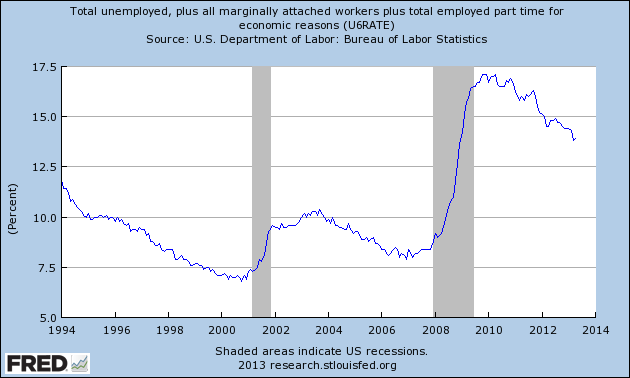
Without a doubt, the unemployment rate is improving – but remains so historically elevated that talk of a general labor shortage is funny. Of course, there will always be jobs that are hard to fill because of skill mismatches – and there will always be pockets where jobs exceed the labor which is available in that market.
One would expect to see an increase in job openings in a sector facing a labor shortage. I picked two skilled sectors that have high levels of real employment that some believe are facing a skilled labor shortage – education / healthcare and professional business services.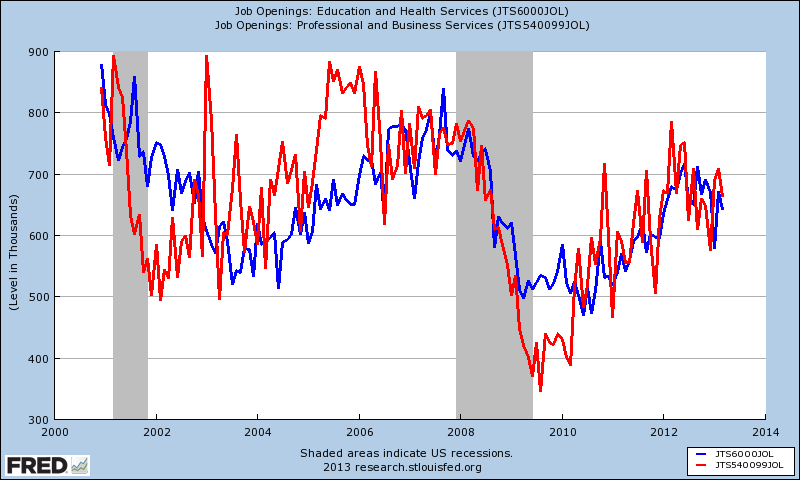
Not only are they currently below post recession peaks, but are also well below pre-recession peaks. The same sort of graphs can be produced for construction or skilled trades (or even health care and education separately). In other words, it does not appear there are any current indications using Job Opening data of a general labor shortage.
Other Economic News this Week:
The Econintersect economic forecast for May 2012 declined marginally, but remains in a zone which says the economy is beginning to grow normally. There are some warning signs that our interpretation is not correct – but we will see how these play out in the coming months.
The ECRI WLI growth index value has been weakly in positive territory for over four months – but in a noticeable improvement trend. The index is indicating the economy six month from today will be slightly better than it is today. Current ECRI WLI Growth Index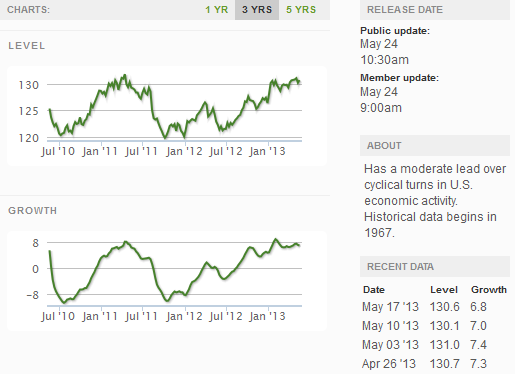
Initial unemployment claims fell from 360,000 (reported last week) to 340,000 this week. Historically, claims exceeding 400,000 per week usually occur when employment gains are less than the workforce growth, resulting in an increasing unemployment rate (background here and here).
The real gauge – the 4 week moving average – was statistically unchanged from 339,250 (reported last week) to 339,500. Because of the noise (week-to-week movements from abnormal events AND the backward revisions to previous weeks releases), the 4-week average remains the reliable gauge. Weekly Initial Unemployment Claims – 4 Week Average – Seasonally Adjusted – 2011 (red line), 2012 (green line), 2013 (blue line)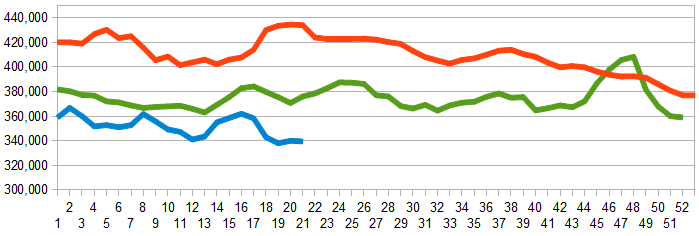
Bankruptcies this Week: none
Data released this week which contained economically intuitive components (forward looking) were:
Weekly Economic Release Scorecard:
Click here to view the scorecard table below with active hyperlinks

Here is the Jobs Openings and Labor Turnover (JOLTS) data from the BLS which Challenger was referring.

Challenger continued:
As the number of job openings rises and the number of unemployed falls, the number of available workers per job opening continues to shrink.
Is headline unemployment a measure of labor slack? Most know my position is that headline unemployment (U-3), or even the all in unemployment (U-6) do not properly measure the potential workforce. Still, the U-6 unemployment rate does provide a broad understanding of labor force slack as it includes people who:
- believe no job is available to them in their line of work or area;
- had previously been unable to find work and are no longer looking;
- lack the necessary schooling, training, skills, or experience; and/or
- think they are too young or too old, or face some other type of discrimination.

Without a doubt, the unemployment rate is improving – but remains so historically elevated that talk of a general labor shortage is funny. Of course, there will always be jobs that are hard to fill because of skill mismatches – and there will always be pockets where jobs exceed the labor which is available in that market.
One would expect to see an increase in job openings in a sector facing a labor shortage. I picked two skilled sectors that have high levels of real employment that some believe are facing a skilled labor shortage – education / healthcare and professional business services.

Not only are they currently below post recession peaks, but are also well below pre-recession peaks. The same sort of graphs can be produced for construction or skilled trades (or even health care and education separately). In other words, it does not appear there are any current indications using Job Opening data of a general labor shortage.
Other Economic News this Week:
The Econintersect economic forecast for May 2012 declined marginally, but remains in a zone which says the economy is beginning to grow normally. There are some warning signs that our interpretation is not correct – but we will see how these play out in the coming months.
The ECRI WLI growth index value has been weakly in positive territory for over four months – but in a noticeable improvement trend. The index is indicating the economy six month from today will be slightly better than it is today. Current ECRI WLI Growth Index

Initial unemployment claims fell from 360,000 (reported last week) to 340,000 this week. Historically, claims exceeding 400,000 per week usually occur when employment gains are less than the workforce growth, resulting in an increasing unemployment rate (background here and here).
The real gauge – the 4 week moving average – was statistically unchanged from 339,250 (reported last week) to 339,500. Because of the noise (week-to-week movements from abnormal events AND the backward revisions to previous weeks releases), the 4-week average remains the reliable gauge. Weekly Initial Unemployment Claims – 4 Week Average – Seasonally Adjusted – 2011 (red line), 2012 (green line), 2013 (blue line)

Bankruptcies this Week: none
Data released this week which contained economically intuitive components (forward looking) were:
- Rail movements are beginning to show a modest growth trend.
Weekly Economic Release Scorecard:
Click here to view the scorecard table below with active hyperlinks

