In the first section of this article, we highlighted three key components/charts illustrating why the “rally to the peak” is very likely a result of a continued Capital Shift away from risk and into the US stock market as an attempt to avoid foreign market growth concerns. This method of pouring capital into the US stock market is a process that is driving incredible asset rallies in the US technology sector. Already the US technology sector (FANG and our Custom Technology Index charts) are up almost 15% in 2020. How long will it last and when will it end?
Recently, China has revised the Coronavirus data with a sharp increase in infection cases – now over 40,000. We believe the true number of infections in China are currently well above 250,000 from video content and other data we’ve researched. We believe economic data originating from China for January and February 2020 will show a dramatic 60% to 80%+ decrease in activity for many of the major cities. Satellite technology suggests manufacturing and consumer activity in most major Chinese cities is only a fraction of what would be considered normal – 10% to 20% or normal levels.
This means the manufacturing capacities in China have collapsed and that supply to the rest of the world will collapse as well. This means major electronics manufacturers and suppliers will suddenly quickly experience shortages and outages very shortly. This is why we believe the technology sector may come under severe pressure over the next 6+ months and why we believe the “high-flying” technology sector may be one of the biggest sector rotations of 2020.
Just how much of a “collapse” are we talking about? How can anyone attempt to quantify the true scope of this potential “black swan” event and how it may result in sector rotation?
Let’s start with some of the basics. First, the global economy has been focused on Chinese manufacturing and production of goods for more than the past 20+ years. Over the past 10 to 15+ years, the Chinese economy has become the central hub of manufacturing and supply for some of the largest economies on the planet. At this point in time, nearly every nation on the planet relies on China in some form for some essential goods that support their local economies.
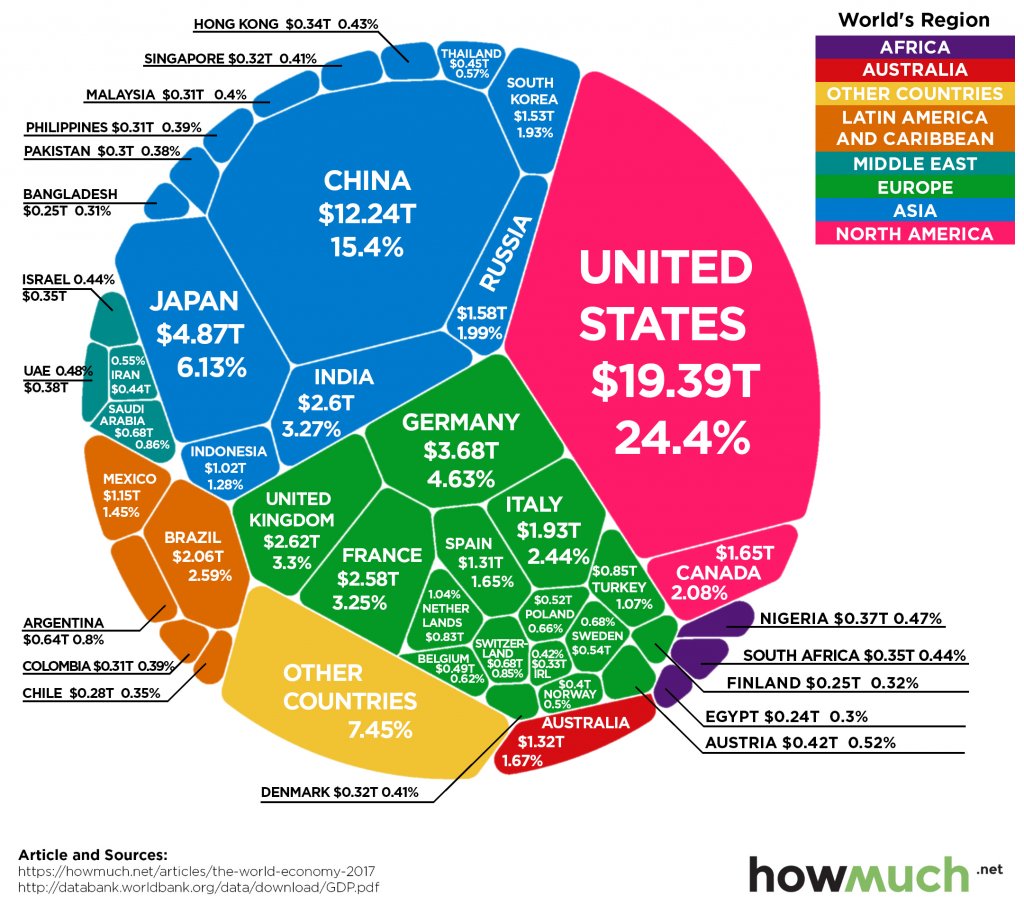
This image showing the size and scope of global economies may highlight just how interconnected we really are. The Chinese economy is 15.4% of the total global economy when taken as a whole compared to other global economies. Yet, China supplies a very large number of these other nations with cheap goods, essential components for industry and manufacturing as well as a very large number of everyday essential items for consumers. So, when we attempt to consider a “shut-down” of the Chinese economy as they attempt to deal with this virus, try to think about how long it would take for the supply chain to dry up and then what?

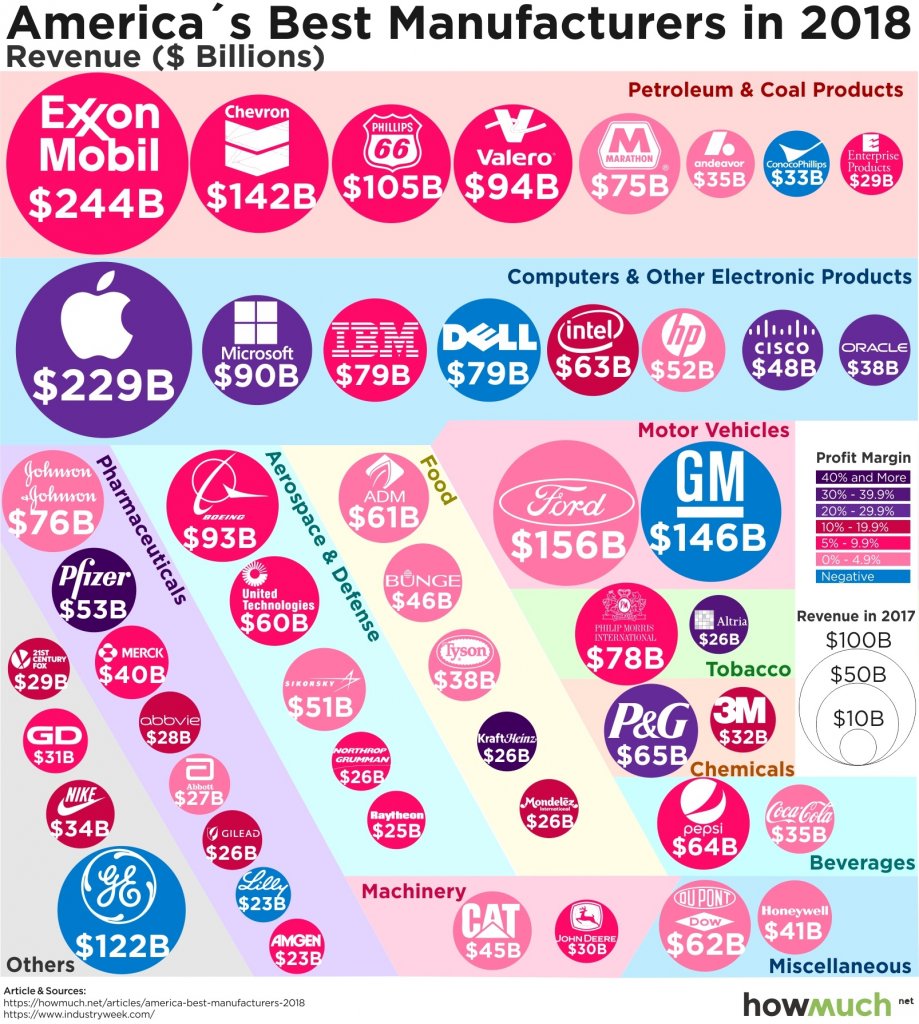
Try to take a moment and think about the total scope of what we’re dealing with in regards to this Corona Virus outbreak. Take a minute to review this graphic from InvestmentWatchBlog.com showing some of the “Best” US firms and how many rely on China for manufacturing/supply of critical components or generate a large portion of their revenues from China.

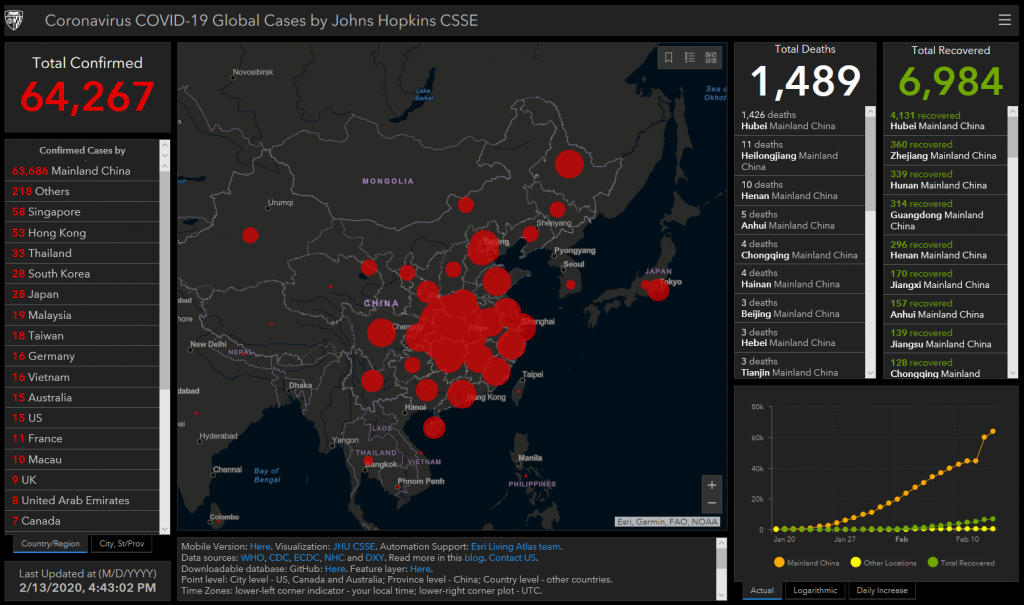
It has been over 45 days since the end of 2019. China knew about this virus fairly early in December 2019. So, in reality, it has been over 75 days since this outbreak first started. The data accumulated by Johns Hopkins CSSE started on January 20, 2020. Since that time, China has experienced a more than 4000% increase in new Corona Virus cases – that is only about 21 days. The number of infected has risen to well over 64,000 and we believe that number (reported by the Chinese government) may be only a fraction (1/8th to 1/6th) of the real infected rate.

Not all technology companies rely on China to supply products and software. Many technology companies have strong core business enterprises that are independent of Chinese manufacturing. Yet we continue to believe the disruption in manufacturing and supply from China will disrupt forward earnings data enough to potentially send the technology sector much lower than current levels. Additionally, if capital rushes out of technology in search of a more suitable opportunity – where will that capital find a new home?
What happens if this “shut down” of the Chinese economy lasts for more than 6+ months and what happens to the world economy as a result of this virus outbreak? In Part III of this research article, we’ll try to share our insight a bit further and attempt to show you where real opportunity exists as this rotation plays out.
