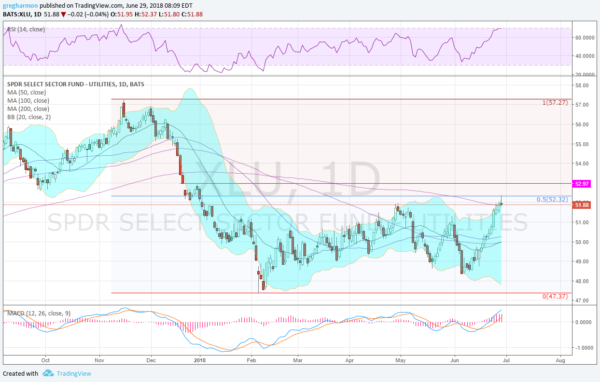
Utility stocks have had a tough run for a while. The Utility Sector ETF (XLU) peaked in November, ahead of the broad market and swiftly reversed. It continued down to a bottom in February over 17% lower. And from there it started a move higher. That move met resistance in April and pulled back again. A series of up and down trends then has it coming into the last day of the quarter after printing its highest level in 2018. Will the strength continue?
The chart below shows that price action. Notice that Thursday ended with a long upper shadow. A possible Shooting Star reversal pattern is building and can be confirmed with a lower close today. It also is holding at the 200 day SMA, a spot it had not seen since December. It is generally considered bullish if the price is above the 200 day SMA, so a push higher from here and close over the 200 day SMA would be a big deal.
Momentum has been strong with the RSI now near 70, on the edge of being overbought, and the MACD rising and positive. These could help push prices higher. The Bollinger Bands® are also opening to the upside. Strong momentum, maybe a bit too strong, and a topping candle support the case for a pullback, even if only mild to reset these indicators. There remains an open gap n the chart above at 52.97 which could also cause a speed bump. Time will tell if Utilities are back on track, but it looks like the case is building.
The information in this blog post represents my own opinions and does not contain a recommendation for any particular security or investment. I or my affiliates may hold positions or other interests in securities mentioned in the Blog, please see my Disclaimer page for my full disclaimer.

