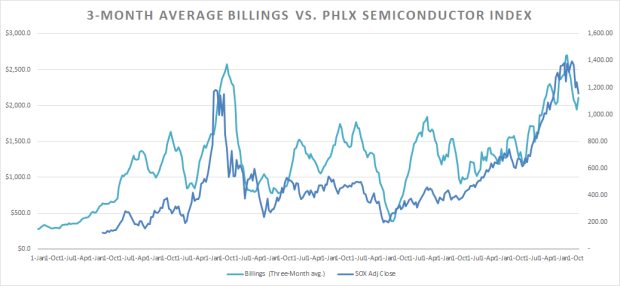
According to Semi.org, North American Semiconductor Billing Spending increased by almost eight percent in December versus November, the first increase in seven months. Whether it is the start of a new trend higher or just a pause in a steeper decline is the big question. But when we combine this with the Lam Research (NASDAQ:LRCX) results, we can see a glimmer of hope for the semis and global economic pick-up. Chips are used in nearly every aspect of our lives today, so if chips are doing better then it is likely to be a positive sign the economy is doing better.
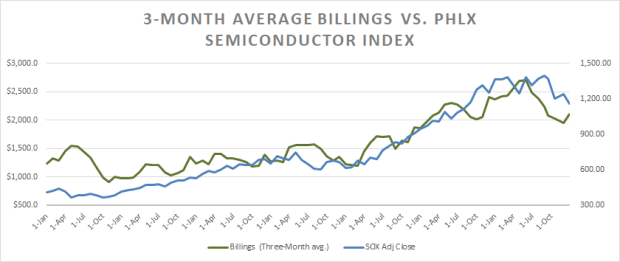
There is a robust correlation historically with billings and the PHLX semiconductor index over the years. So let’s hope that the billings data suggests that the chip sector is due for a turn higher.
Lam Research (LRCX)
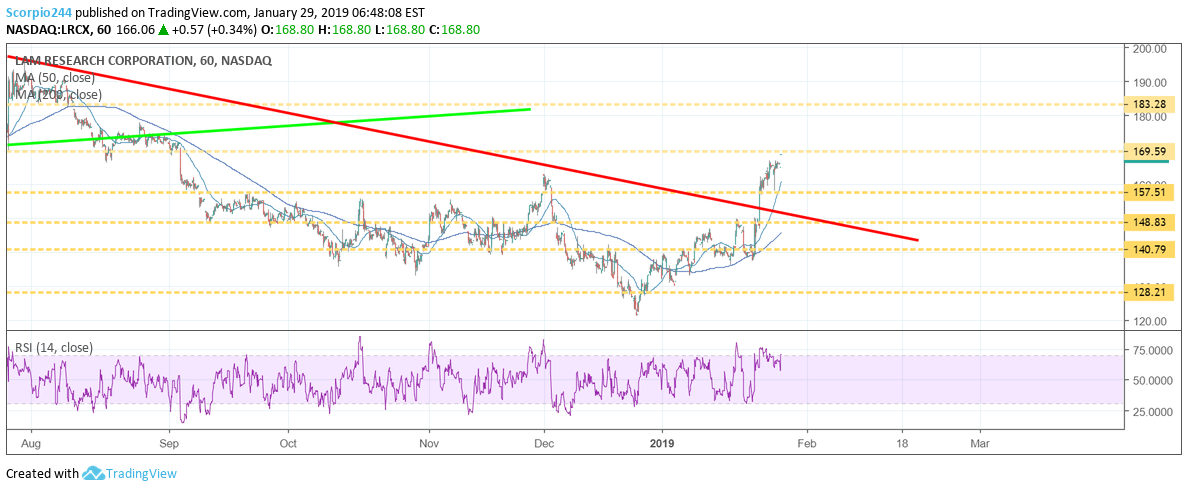
RBC upgraded Lam (NASDAQ:LRCX) to outperform from sector perform, and raised its price target to $190 from $160.
$169.60 is a level of technical resistance for the stock and should it rise above that level it could go to around $183.
Pfizer (PFE)
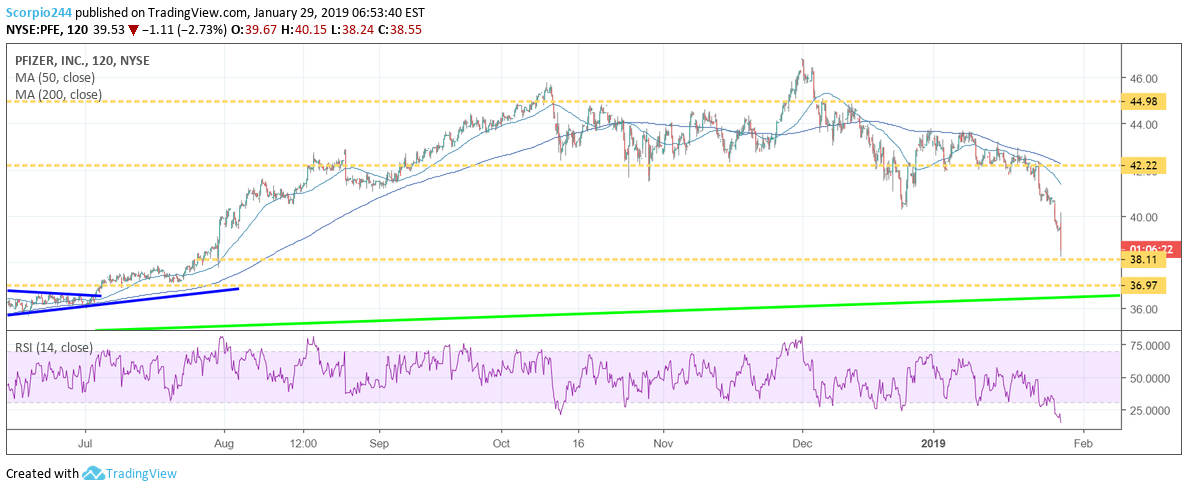
Pfizer (NYSE:PFE) rose on Tuesday despite guiding its fiscal 2019 earnings to $2.87 at the mid-point versus estimates of $3.04. Meanwhile, the company sees revenue at $53 billion at the mid-point versus estimates of $54.3 billion.
The stock has fallen sharply over the past few months after reaching a multi-year high in November. The stock is trading near a significant level of support around $38, a drop below $38 sends the stock lower towards $37.
3M (MMM)
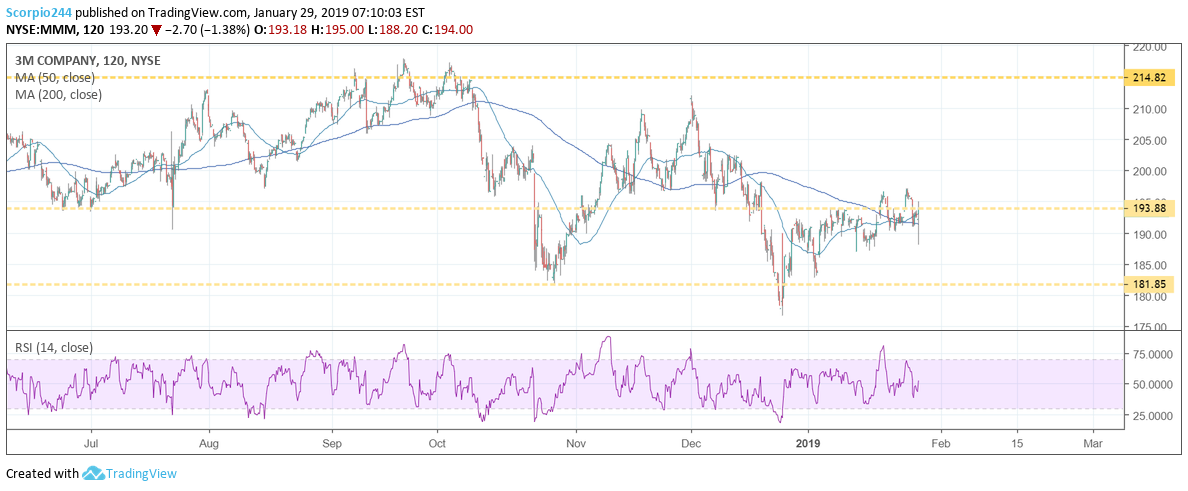
3M (NYSE:MMM) rose Tuesday after it guided its 2019 EPS to $10.45 to $10.90 versus consensus of $10.70. At the mid-point, guidance is a touch below consensus.
The shares have struggled at resistance at $194, but it rose well above that level on Tuesday; it is likely to continue to be a battleground zone for the stock.
Verizon Communications (VZ)
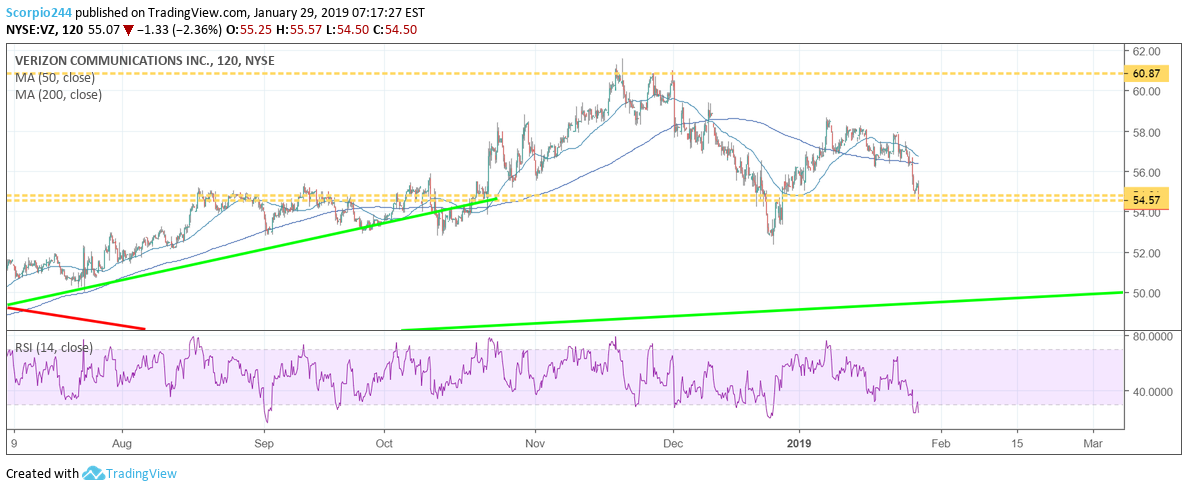
Verizon (NYSE:VZ) fell after it reported earnings that beat estimates by $0.03 per share but missed on revenue at $34.28 billion below consensus of $34.45 billion.
The stock is trading within a key level of support around $54.50. A drop below that region could send the stock lower back towards $52.
Square (SQ)
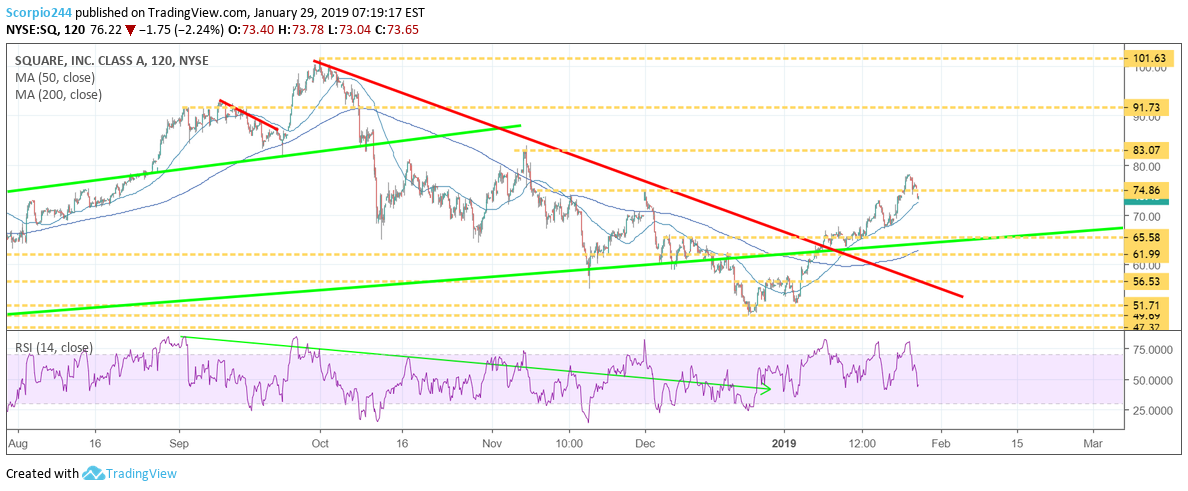
Square (NYSE:SQ) took a big hit Tuesday after Raymond James cut the stock to underperform from market perform. The stock is trading well below support at $74.80, but the trend is still higher at the moment.
Nvidia (NVDA)
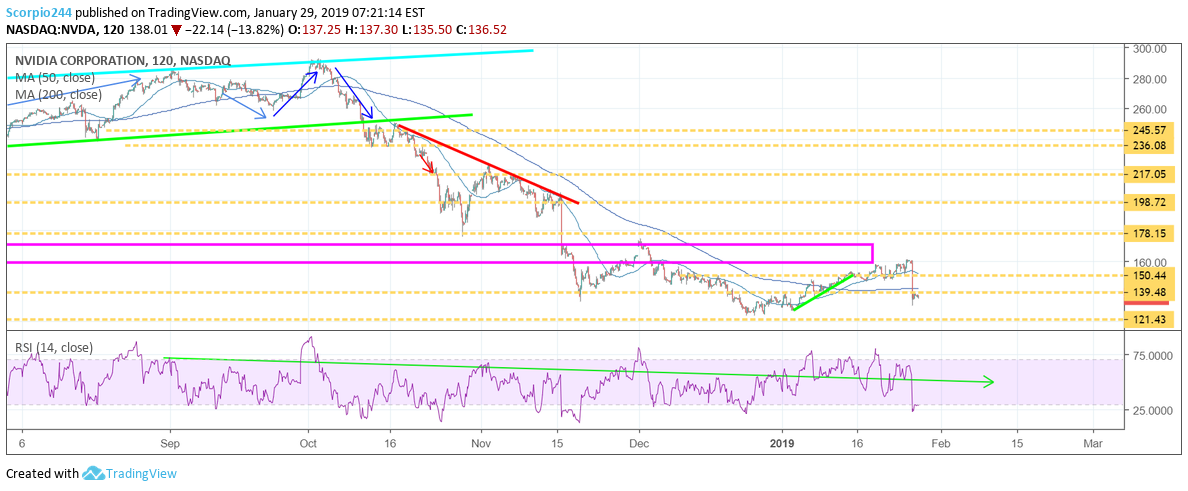
NVIDIA (NASDAQ:NVDA) was downgraded by Morgan Stanley (NYSE:MS) to equal-weight from outperform; it was also lowered by Needham to underperform from buy but was upgraded at UBS to buy from neutral. Expect more upgrades/downgrade and price target changes in the days to follow after the disastrous quarter.
Resistance for the stock remains around $139, but downside risk continues to be around $121.
Disclaimer: Michael Kramer and the clients of Mott Capital own Apple (NASDAQ:AAPL), Verizon (NYSE:VZ), Microsoft (NASDAQ:MSFT), Tesla (NASDAQ:TSLA)

