I wrote about gold a few weeks ago here. In that article, I said if we're not at the bottom in gold, we're close.
Since then, gold had a brief rally and is right about back to where it was. It's easy to look at the price action in the metal and get impatient. I get it.
When I first started investing, I would get angry when something moved against me. Years later, I have learned to be much better about taking emotion out of the equation. When trades don't do what we think they're going to do, it's important to re-visit the original thesis and see if it still holds up. With that being said, is the metal selloff over?
Cost of Capital and Debt
I'm not going to re-write my entire article from earlier this month. But we can look to the rising Treasury yields, particularly the 10-year note, as the reason for the weakness in the spot prices of both gold and silver. In the chart below, we can see an enormous move up in yields since they bottomed in early August.
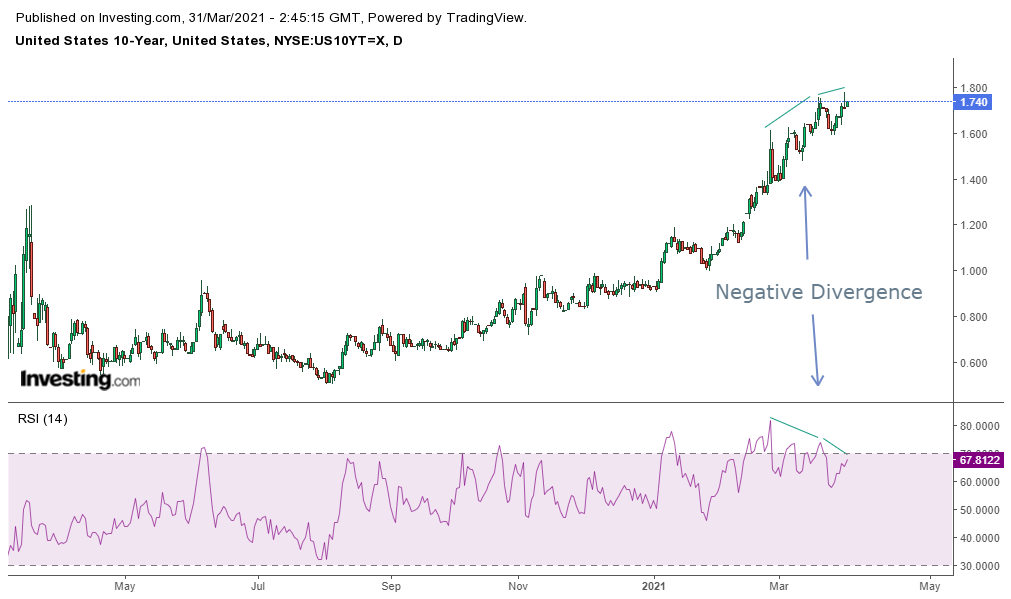
This chart shows some pretty clear negative divergences on the daily chart. The indication here would be potential exhaustion in the yield increase. Of course, this is just a technical viewpoint. There's a fundamental setup that must be considered when talking about Treasury yields. Simply put, the cost of credit can not increase further without causing serious systemic issues.
The reason for this is the massive debt burdens throughout the economy and the government. Take federal debt as a percentage of GDP as an example.
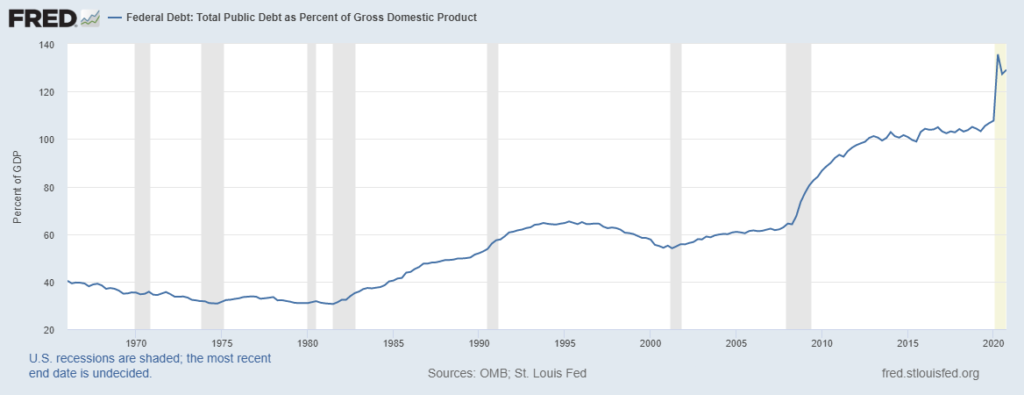
It speaks for itself. The government simply cannot endure a scenario where it has to allocate more of the federal budget to paying interest. Especially considering quarterly federal tax receipts peaked in Q4-2019.
Gold and Silver Charts
Judging from what I've seen in comment sections and online, sentiment on the precious metal is very poor. When sentiment is this bad, it's usually a sign the reversal is close. A quick glance at the daily chart shows a pretty ugly picture. After a failed breakout attempt in January, there has been very little relief for gold bulls.
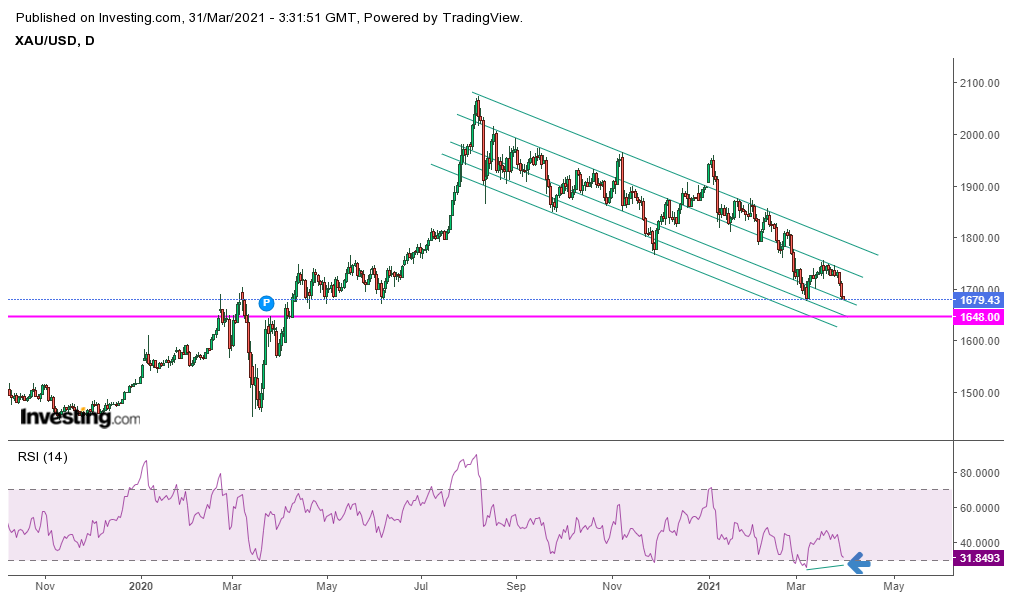
The good news is there is a positive divergence forming on the daily. I'm expecting one final washout this week to the $1,650 area before the reversal. Truth be told, I'm expecting this final washout to happen shortly. I think we get our bottom in the next day or two. We'll get an abysmal close to both the quarter and the month for gold. That said, this chart is far from broken.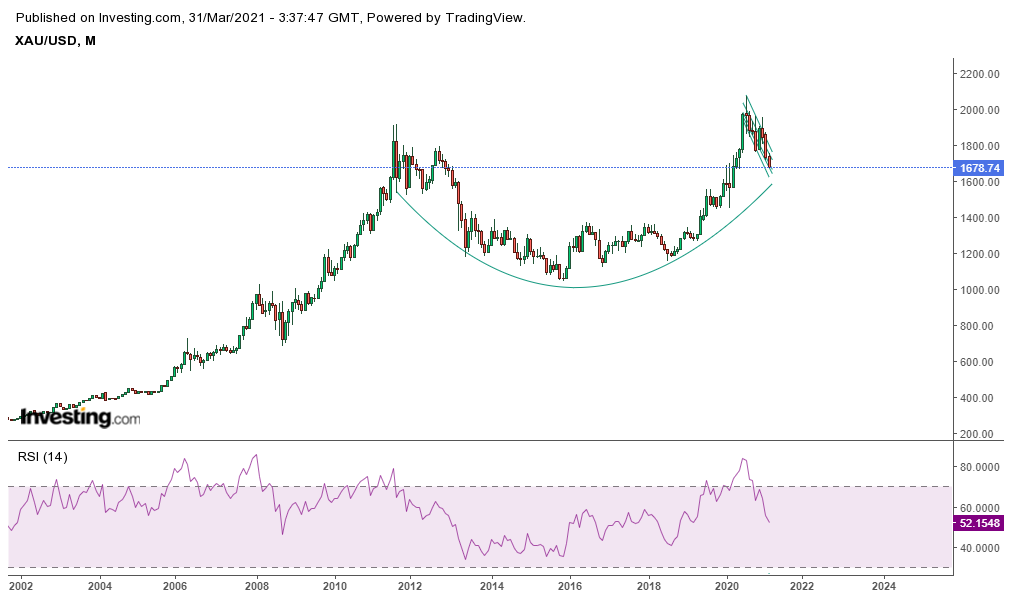
I see a massive cup and handle on the gold's monthly forming. Like gold, silver's chart doesn't have me worried at all either.
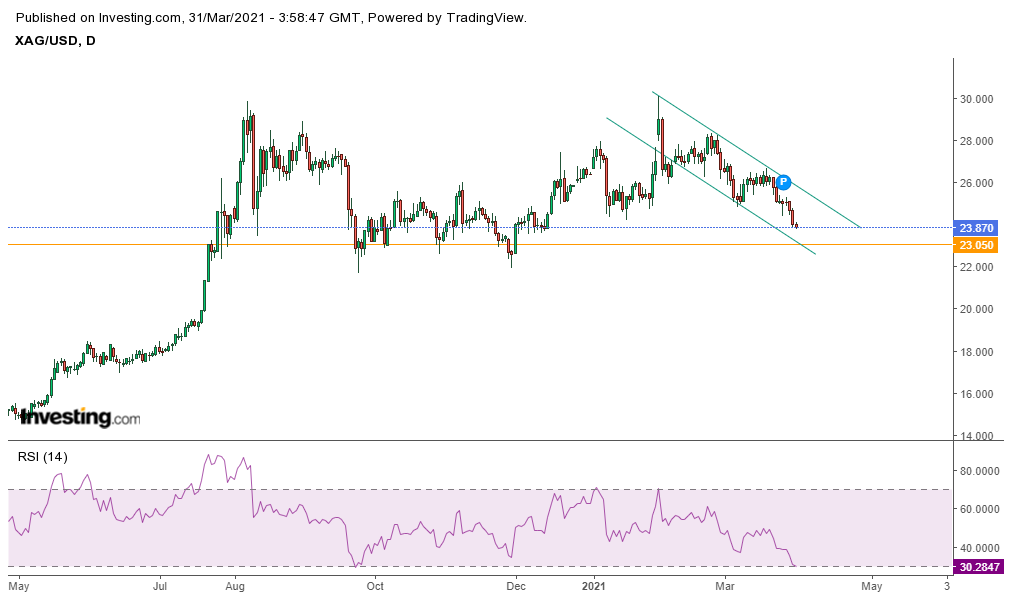
I think the bottom in silver is in this week too. It probably has another 80 cents or so to go. I'd be very surprised if silver stays below $23 for an extended period of time. We're very close to oversold on the daily chart and we're well above the high-teen historic resistance levels of the last few years. I firmly believe we have the final shakeout on our hands. After all, I'd be remiss if I didn't mention this is all just the spot market price. If you actually want to hold the metal in your hand, you're going to have to pay a real market price. But I'll leave that alone for now.
Summary
Is the metal selloff over? Probably not. But from here I see very little downside to adding to a metal position. I have been adding to my core miner plays all month. And I am very long Sprott Physical Gold and Silver Trust (NYSE:CEF).
Standard Disclaimer: I'm not a financial adviser. Please do your own research.
