Key Points:
- Strong zone of support around the 1.3103 mark.
- Bullish daily EMA activity.
- Parabolic SAR readings remain highly bullish.
After only so recently breaking free of its ascending triangle structure, eyes are once again on the loonie as the pair could be moving back below the key 1.3103 level. However, there is mounting evidence that the USD/CAD is set to bounce off support and turn bullish going forward. Namely, EMA activity and stochastic readings are providing some strong reasons to expect support to hold in the coming sessions.
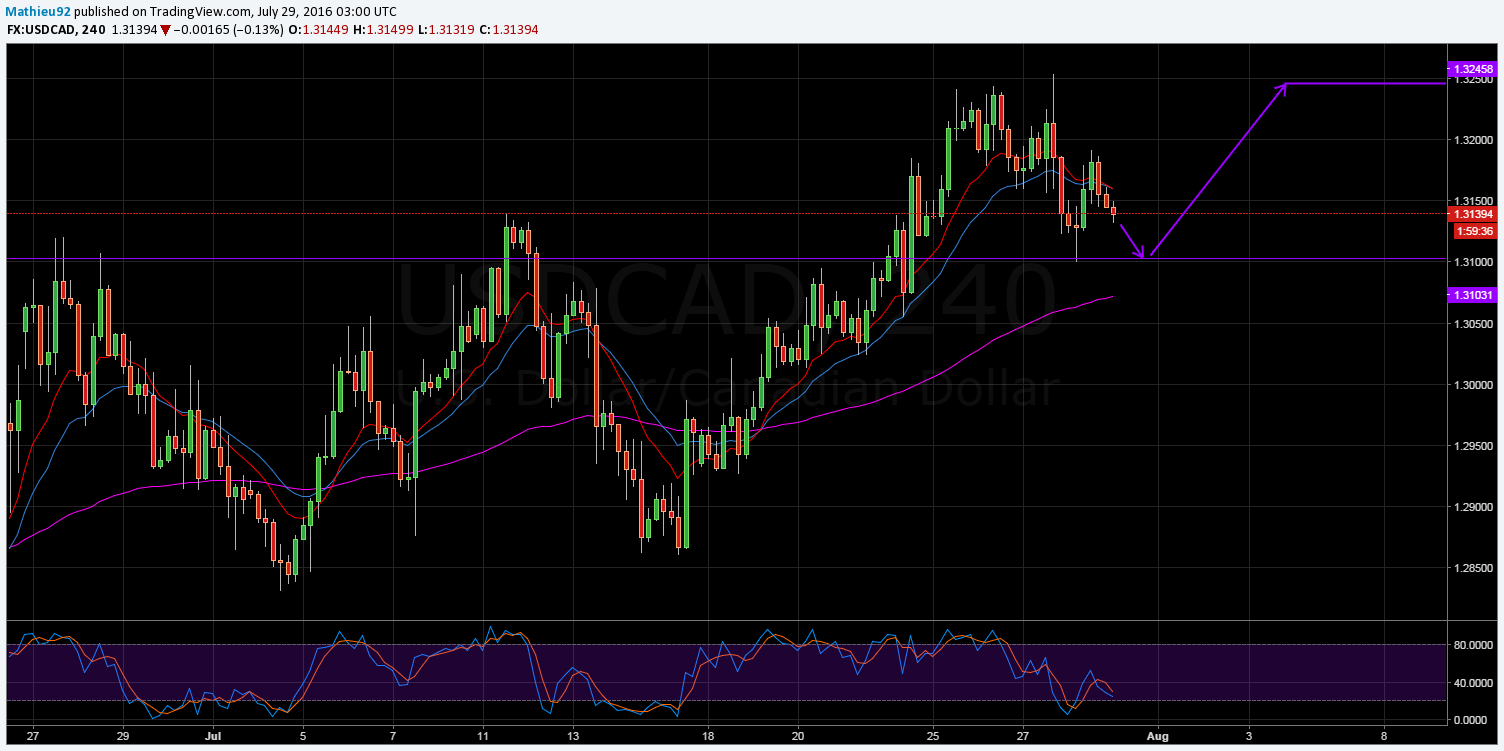
First and foremost, the H4 chart shows a number of important factors which should mean that the loonie turns bullish after testing support. As shown, the H4 EMA activity is on the cusp of becoming somewhat bearish which should subsequently see the pair make the move back to the 1.3103 mark.
The move to the downside here is important largely because the dip will push the stochastics into oversold territory. In turn, this will see support around the 1.3103 level intensify significantly.

In addition to becoming oversold, support at 1.3103 should hold firm by virtue of the fact that it also represents the 38.2% Fibonacci retracement. Combined, the oversold reading and Fibonacci level should make breaking back through this key level highly difficult. In fact, this was the case only recently where the pair tested but was ultimately unable to breach the rather robust zone.
On the daily chart, there is additional evidence signalling that the loonie isn’t ready to sink below the 1.3103 level just yet. Contrary to the H4 EMA activity, the daily EMA is actually bourgeoning on bullish as it recently experienced a bullish crossover and the 100 day EMA is now positively sloped.
Furthermore, the daily stochastics have now moved out of overbought which will give the pair some upward mobility. Potentially more important however, are the relatively strong readings being given by the Parabolic SAR.
Even with the loonie’s recent slip, the indicator remains staunchly bullish which could begin to be felt as the pair draws nearer to the pivotal support level.
Ultimately, the loonie is unlikely to remain bullish for long and should run into stiff resistance around the 1.3245 mark. This of course represents the pairs recent high, a level which will probably require some strong fundamentals to be broken.
As a result, keep an eye on the technicals as the pair reaches towards this level as they could hint at an early turning point for the pair.
