Is The GBP/USD Consolidation About To Breakdown?

Published 04/08/2016, 05:48 AM
Updated 05/14/2017, 06:45 AM
GBP/USD
-

It has been a relatively rocky ride for the venerable cable over the past few weeks as the talk of a Brexit continues to impact the currency. However, despite some of the recent selling, the pair is firmly within the grips of a consolidation pattern that could see some dramatic moves in the week ahead.

Undertaking a technical analysis of the cable’s 4-Hour chart yields some potentially interesting clues for the week ahead. It is readily apparent that the currency pair has largely been trapped within a slightly bearish consolidating channel since the middle of March. Although the pair has reacted sharply to a range of external shocks, including increased talk of a Brexit, price action has remained within a relatively tight range. However, some sharp recent selling has seen the pair trend towards the bottom of the range which could indicate a strong move ahead.

RSI Chart

In fact, the technical indicators are showing some interesting signals as the RSI Oscillator remains relatively flat, near oversold territory, despite the recent price declines. Subsequently, there is some divergence between the indicator and price action that could be indicating a reversal of the short term trend. In confluence with RSI, the stochastic oscillator is also deep within oversold territory which lends further credence to the argument for a short term reversal.
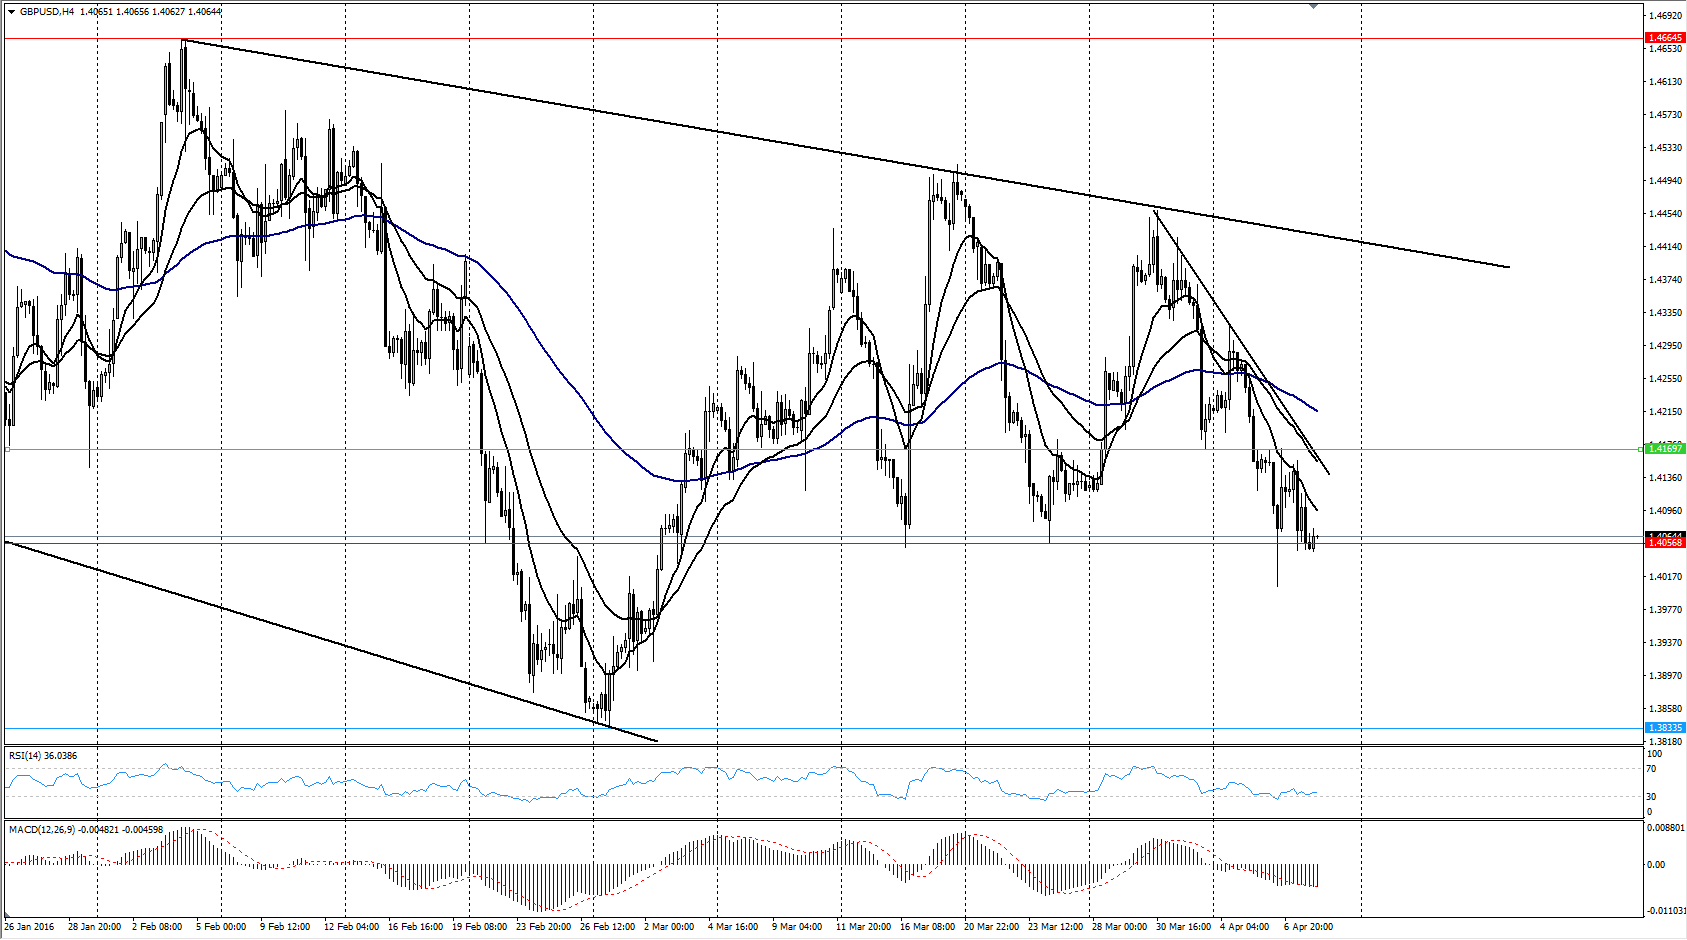
GBP/USD 4-Hour Chart

Subsequently, there is plenty of scope for the entry of a long position above the key 1.4170 resistance level. Alternatively, a break below the 1.40 handle would indicate a sharp push towards the bottom of the channel is likely. However, be aware of any short side move as the Risk/Reward ratio is not advantageous.

Ultimately, the cable’s forward trend is likely to wait upon the UK Manufacturing Production results before making a strong move. However, given the recent collapse in the pair’s value, the downside might be relatively limited. Subsequently, the most likely scenario is a sideways consolidation at the current level before a challenge of the 1.4170 resistance level.

Latest comments

Loading next article…
Risk Disclosure: Trading in financial instruments and/or cryptocurrencies involves high risks including the risk of losing some, or all, of your investment amount, and may not be suitable for all investors. Prices of cryptocurrencies are extremely volatile and may be affected by external factors such as financial, regulatory or political events. Trading on margin increases the financial risks.
Before deciding to trade in financial instrument or cryptocurrencies you should be fully informed of the risks and costs associated with trading the financial markets, carefully consider your investment objectives, level of experience, and risk appetite, and seek professional advice where needed.
Fusion Media would like to remind you that the data contained in this website is not necessarily real-time nor accurate. The data and prices on the website are not necessarily provided by any market or exchange, but may be provided by market makers, and so prices may not be accurate and may differ from the actual price at any given market, meaning prices are indicative and not appropriate for trading purposes. Fusion Media and any provider of the data contained in this website will not accept liability for any loss or damage as a result of your trading, or your reliance on the information contained within this website.
It is prohibited to use, store, reproduce, display, modify, transmit or distribute the data contained in this website without the explicit prior written permission of Fusion Media and/or the data provider. All intellectual property rights are reserved by the providers and/or the exchange providing the data contained in this website.
Fusion Media may be compensated by the advertisers that appear on the website, based on your interaction with the advertisements or advertisers.
© 2007-2025 - Fusion Media Limited. All Rights Reserved.