🎯 Trump Tariffs Hit Markets: Here's What Smart Investors Should ConsiderRead now

Is The Franc Ready To Pull Back Again?

Published 05/20/2016, 02:36 AM

The Swissie has been rallying strongly recently but the pair could be running out of momentum as it edges closer to the 0.9966 resistance level. Furthermore, a combination of stochastics, chart patterns, and fundamentals are hinting that a reversal is on the cards. Consequently, Swissie Bulls might be in for a shock in the near future.

Firstly, the most damning evidence which is suggesting the USD/CHF is about to make a move a lower is a Gartley Pattern. Specifically, a relatively robust bearish bat pattern has formed and is hinting at future downside potential for the pair. Additionally, the USD/CHF is nearing the 0.9966 price level which has proven difficult to break.
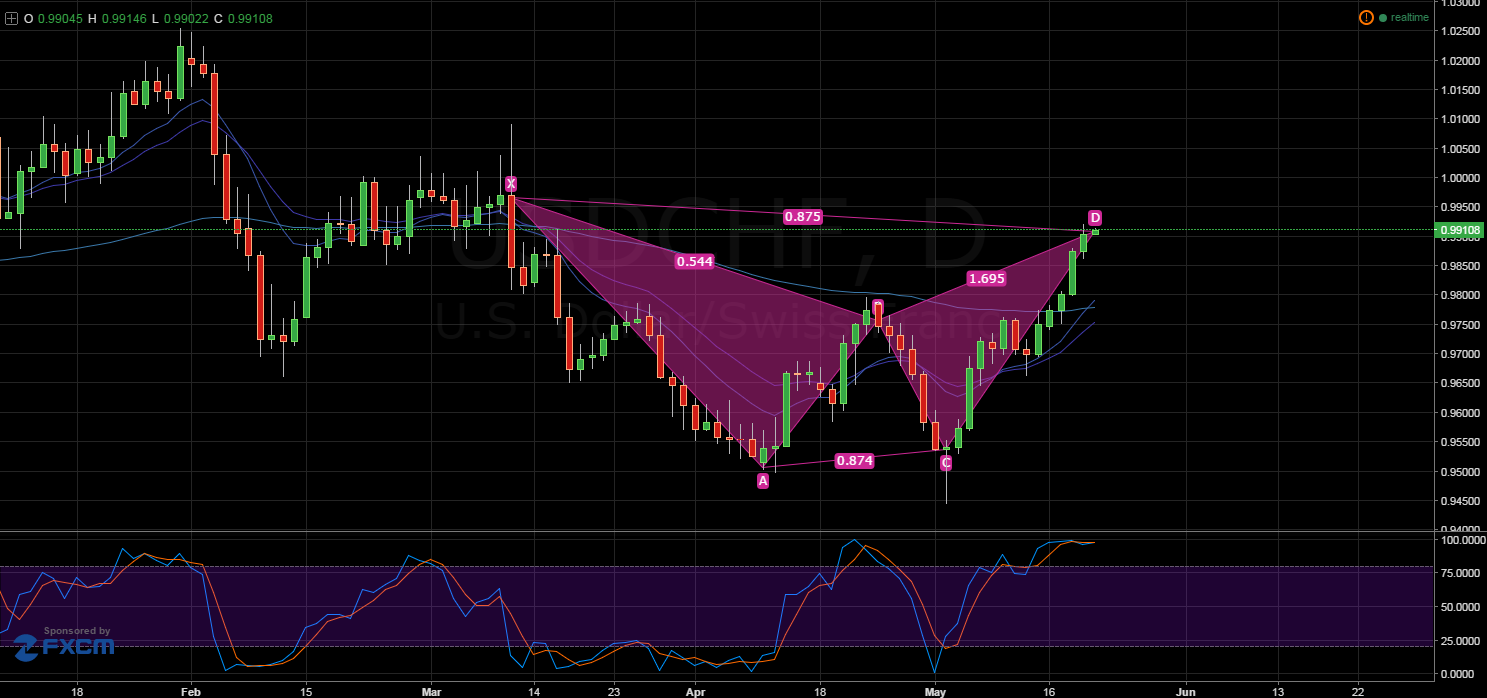
USD/CHF Daily Chart

In addition to the bat pattern, looking at the H4 chart reveals that an ABC formation is nearing completion. What’s more, this ABC pattern constitutes the final leg of the Bat which will be adding to any speculation surrounding the pair. However, it is worth keeping in mind that the ABC could in reality be an incomplete 3 drive or Elliot wave pattern. If this is the case, the Swissie could be set to climb at least once more before subsequently crashing.
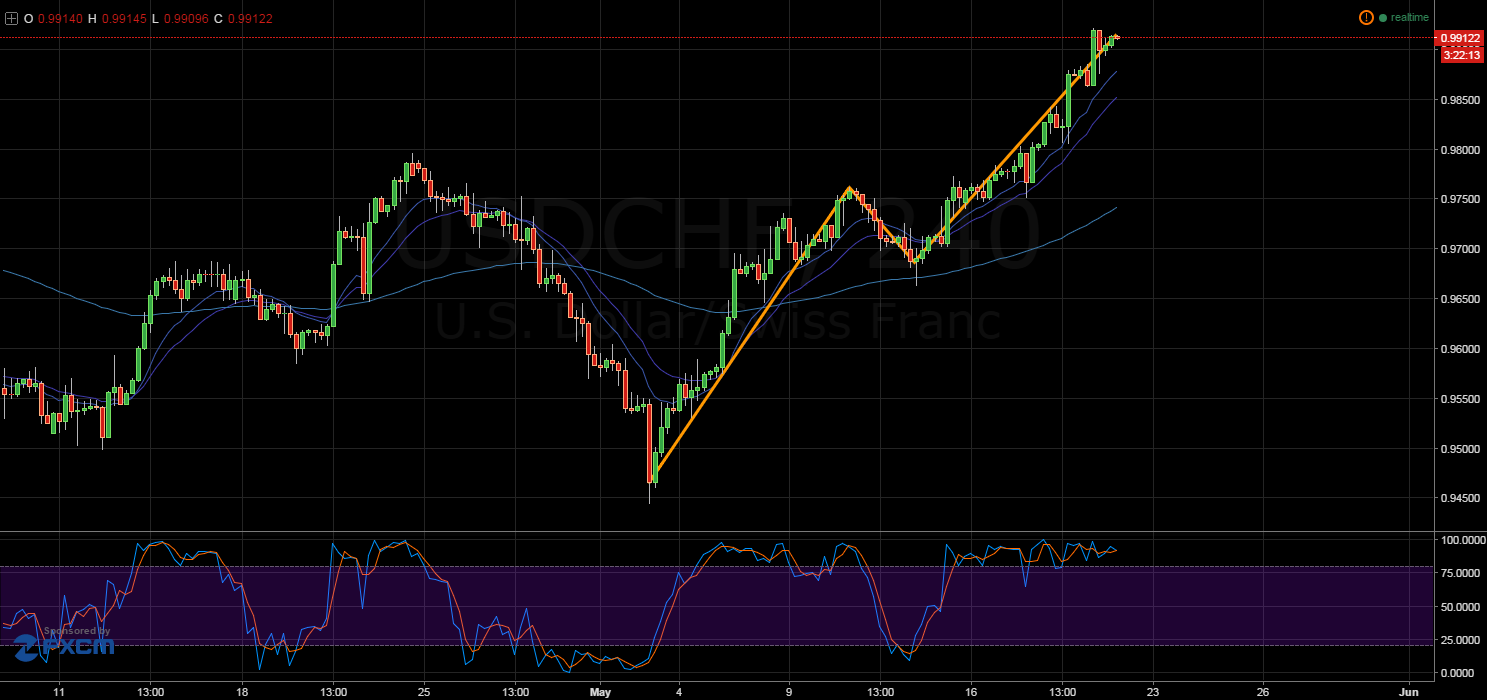
USD/CHF 4-Hour Chart

Whilst the formation of a bearish bat and ABC pattern are convincing, stochastic oscillator readings give further reason to suspect an imminent fall for the USD/CHF. Importantly, the oversold reading is present on not only the daily but also the H4 and H1 charts. As a result, selling pressure will be mounting later in Friday’s session, especially as London and New York come online.

3rd party Ad. Not an offer or recommendation by Investing.com. See disclosure here or remove ads.

On the fundamental front, a contraction in the Philadelphia Federal Manufacturing Index and softer than expected US Unemployment Claims figures could limit or even reverse the recent bullishness of the pair. Considering the result was forecasted at a 3.3 increase, the 1.8 contraction in the manufacturing index is likely to make its presence felt as the trading week comes to an end. Likewise, the underwhelming 278K US Unemployment Claims figures could significantly limit the pair's upwards mobility during the remainder of the session.

Ultimately, the current resurgence of the greenback is likely to be relatively short lived. Moreover, the recent FOMC minutes can be attributed to causing the relative bullishness of the USD. As a result, the Swissie will likely correct to the downside in the near future. There is a chance that the pair has another rally in the interim, but in the end, the underlying weakness of the US economy should drive the pair back to support.

Which stock should you buy in your very next trade?

AI computing powers are changing the stock market. Investing.com's ProPicks AI includes 6 winning stock portfolios chosen by our advanced AI. In 2024 alone, ProPicks AI identified 2 stocks that surged over 150%, 4 additional stocks that leaped over 30%, and 3 more that climbed over 25%. Which stock will be the next to soar?

Unlock ProPicks AI

Latest comments

Loading next article…
Risk Disclosure: Trading in financial instruments and/or cryptocurrencies involves high risks including the risk of losing some, or all, of your investment amount, and may not be suitable for all investors. Prices of cryptocurrencies are extremely volatile and may be affected by external factors such as financial, regulatory or political events. Trading on margin increases the financial risks.
Before deciding to trade in financial instrument or cryptocurrencies you should be fully informed of the risks and costs associated with trading the financial markets, carefully consider your investment objectives, level of experience, and risk appetite, and seek professional advice where needed.
Fusion Media would like to remind you that the data contained in this website is not necessarily real-time nor accurate. The data and prices on the website are not necessarily provided by any market or exchange, but may be provided by market makers, and so prices may not be accurate and may differ from the actual price at any given market, meaning prices are indicative and not appropriate for trading purposes. Fusion Media and any provider of the data contained in this website will not accept liability for any loss or damage as a result of your trading, or your reliance on the information contained within this website.
It is prohibited to use, store, reproduce, display, modify, transmit or distribute the data contained in this website without the explicit prior written permission of Fusion Media and/or the data provider. All intellectual property rights are reserved by the providers and/or the exchange providing the data contained in this website.
Fusion Media may be compensated by the advertisers that appear on the website, based on your interaction with the advertisements or advertisers.
© 2007-2025 - Fusion Media Limited. All Rights Reserved.