Key Points:
- Testing upside constraint of descending triangle.
- 100 day EMA is providing dynamic resistance.
- Challenging the 38.2% Fibonacci retracement
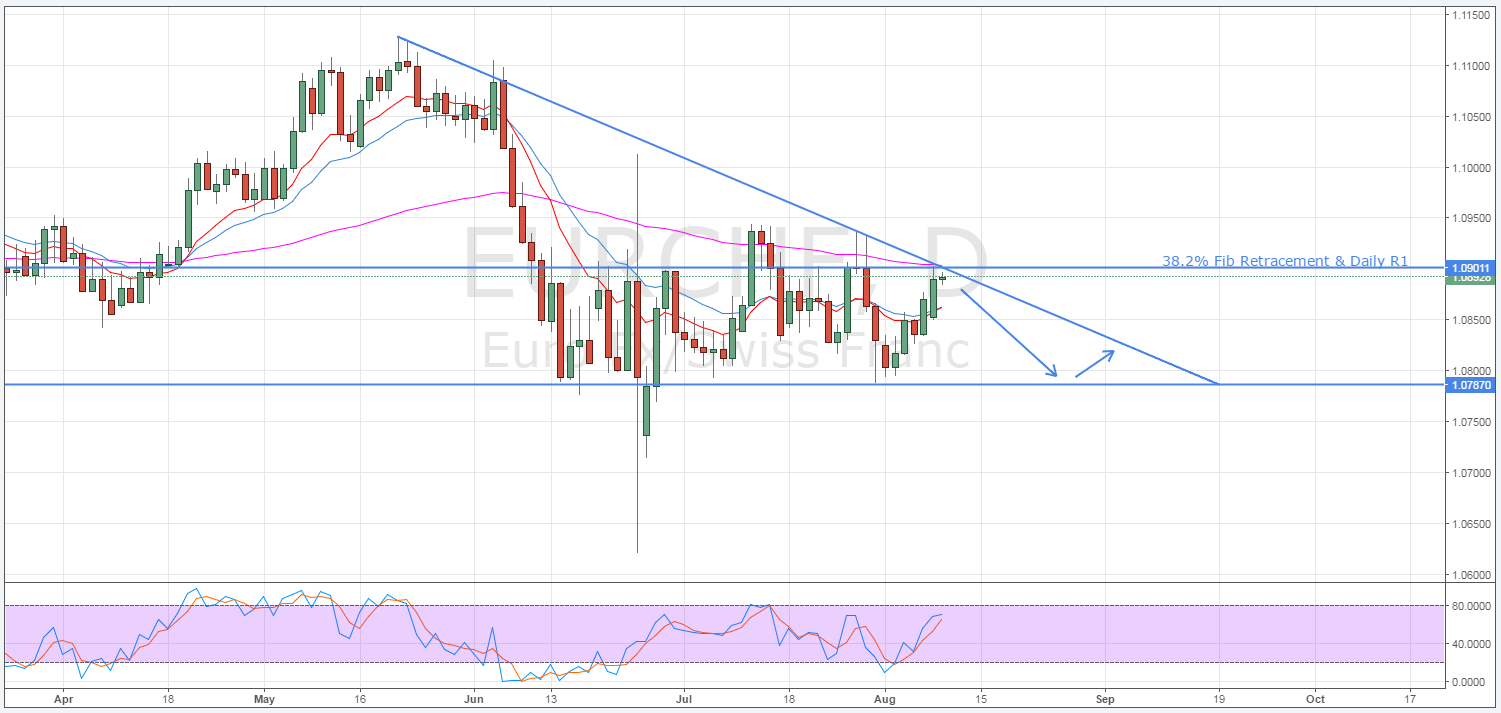
A plunge back to a long-term support could be on the cards for the EUR/CHF as it reaches a probable inflection point. Specifically, the pair is reaching the upside constraint of a descending triangle pattern at a point which intersects with not only a daily R1 level, but also a Fibonacci retracement. Furthermore, this confluence of technical events is occurring just as the pair challenges the dynamic resistance supplied by the 100 day EMA.
As shown on the daily chart, the EUR/CHF is in the process of completing a descending triangle pattern. As is typical of a pair confined by this structure, this should mean a reversal is set to occur in the very near future. However, as the constraints of this pattern have been tested only a few times, there could be some doubt that the current resistance remains intact. Fortunately, there are a host of other technical factors signalling that the pair has reached a turning point and is now poised to descend once again.

Firstly, one of the most obvious reasons to suspect a reversal around the 1.0901 level is the 100 day EMA. As shown above, the moving average is currently exerting some downward pressure on the pair as it acts as a source of dynamic resistance. On its own, this might not be enough to cap additional bullishness as we have only seen it prevent the EUR/CHF’s rally twice recently. However, the fact that this coincides with the 38.2% Fibonacci level should significantly increase the robustness of this zone of resistance.
In addition to the 100 day EMA and the 38.2% retracement providing resistance at the 1.0901 level, the existence of a daily R1 level at this price further suggests this could be a turning point. Using some daily pivot point analysis, remarkably, the R1 level overlaps with the 1.0901 zone of resistance almost perfectly. As a result, there is a very strong probability that the EUR/CHF will fail in its latest attempt to break out of its triangle formation.
Once the pair has reversed, it will likely run into support again around the 1.0787 mark. Here, support has proven to be highly resistant to breakouts as it has been challenged repeatedly since September. On the few occasions where there has been a temporary breakout, the pair has never strayed below this price for long. Consequently, it makes sense that this represents the downside constraint of the descending triangle structure.
Ultimately, the German Trade Balance result and the Swiss Unemployment Rate release could prove somewhat of a disruptive force in the coming session. Specifically, a strong outcome for the German data could see the pair defy the technical bias and produce a rally. Likewise, a surprise uptick in the Swiss Unemployment rate could prevent the pair from reversing and delay the triangle’s completion. As a result, keep an eye on the fundamentals as they are well worth watching over the coming session.
