Many pundits use Federal Government revenues as a pulse point for understanding the economy. If government revenues are a good tool, then the economy over the last two months should be expanding robustly as revenues are growing in double digits. It makes sense – all things being equal – that increased tax revenue means people and business are more profitable and / or sales are increasing.
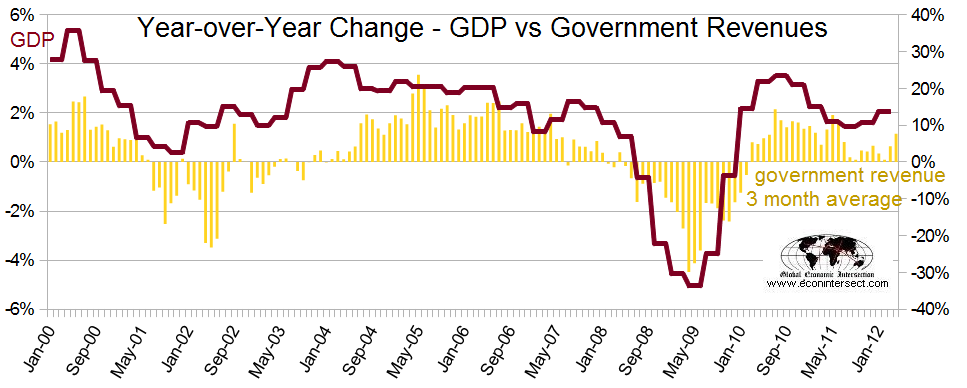
On average since 2000, government revenues have averaged a 2.5% increase year-over-year (GDP has averaged 1.8% year-over-year growth).
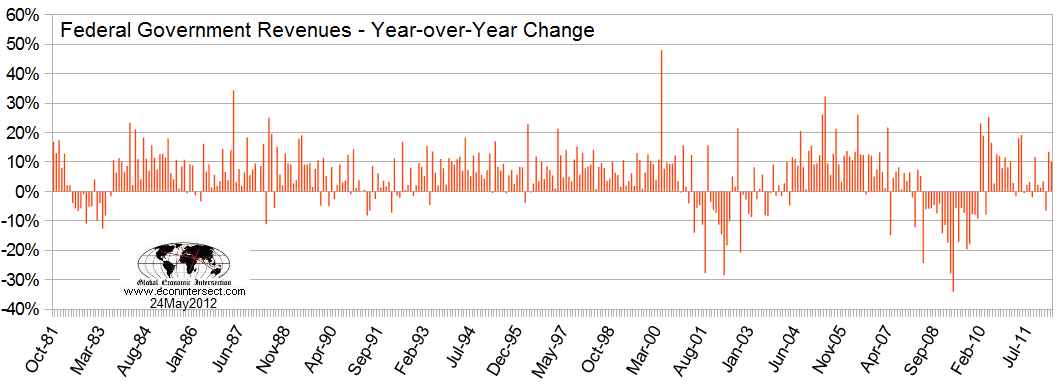
Some tax revenue is coincident with economic activity, but all important profits would be a lagging indicator as profit should be unknown until the end of a calendar year. For me, little is revealed by looking at government revenue. The primary problem is that it lags and is very noisy (I will ignore changing tax laws) – and is poor in spotting a recession. The graph below uses the government revenues, and shows year-over-year change.
One cautionary note: Although still growing year-over-year, the rate of growth in personal withholding revenues has been decreasing over the past several weeks which indicates that employment growth in May may be less than has been experienced so far in 2012. This would be a continuation of the disappointing job growth numbers that were reported in April. 
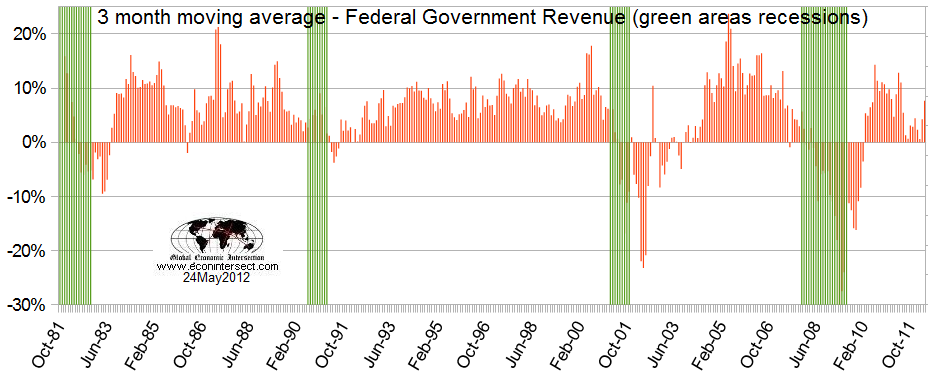
One positive aspect of watching government revenues is that there is little significant backward revision so data is good in real time. It is possible to remove much of the noise in government revenue by using a three month rolling average of the data.
Take a look at the recession in the early 90′s – the contraction in government revenues did not occur until the recession ended. Even if one uses trend lines, the trends go up and down without a recession occurring. Comparing government revenues to GDP.
The question of the day is growing government tax revenues forecasting (or showing) an improving economy. In my opinion, correlations between economic growth (expressed as GDP) and government revenues are not good enough to use as a forecasting tool on its own.
However, the current trend of improving government revenue growth is a positive signal. There has never been a positive growth trend leading into any recession since 1990 – but there has been many negative growth trends which have never evolved into a recession.
Other Economic News this Week:
The Econintersect economic forecast for May 2012 shows moderate growth. There was some improvement in the government pulse point, but degradation in some of our transport related pulse points. Overall, the pluses and minuses balanced out.
ECRI has called a recession. Their data looks ahead at least 6 months and the bottom line for them is that a recession is a certainty. The size and depth is unknown but the recession start has been revised to hit around mid-year 2012.
This week ECRI’s WLI index value has been jumping around due to backward revision. The index is hovering around zero which means the economy six month from today will be as bad as it is today. 
Initial unemployment claims were essentially unchanged – 370,000 (reported last week) to 370,000 this week. Historically, claims exceeding 400,000 per week usually occur when employment gains are less than the workforce growth, resulting in an increasing unemployment rate (background here and here). The real gauge – the 4 week moving average – fell from 375,000 (reported last week) to 370,000. Because of the noise (week-to-week movements from abnormal events AND the backward revisions to previous weeks releases), the 4-week average remains the reliable gauge. 
Data released this week which contained economically intuitive components (forward looking) were rail movements which is still indicating a moderate expansion if one ignores coal. A this was a light data week, the only other remotely economic intuitive release was the Chicago Fed National Activity Index (CFNAI) which unfortunately is not accurate in real time due to backward revisions. This index was mixed but not close to being recessionary.
Weekly Economic Release Scorecard:
Click here to view the scorecard table below with active hyperlinks.
Bankruptcies this Week: Houghton Mifflin Harcourt Publishing
- English (UK)
- English (India)
- English (Canada)
- English (Australia)
- English (South Africa)
- English (Philippines)
- English (Nigeria)
- Deutsch
- Español (España)
- Español (México)
- Français
- Italiano
- Nederlands
- Português (Portugal)
- Polski
- Português (Brasil)
- Русский
- Türkçe
- العربية
- Ελληνικά
- Svenska
- Suomi
- עברית
- 日本語
- 한국어
- 简体中文
- 繁體中文
- Bahasa Indonesia
- Bahasa Melayu
- ไทย
- Tiếng Việt
- हिंदी
Is The Economy Improving As Tax Revenues Are Growing?
Published 05/26/2012, 08:25 AM
Is The Economy Improving As Tax Revenues Are Growing?
Latest comments
Loading next article…
Install Our App
Risk Disclosure: Trading in financial instruments and/or cryptocurrencies involves high risks including the risk of losing some, or all, of your investment amount, and may not be suitable for all investors. Prices of cryptocurrencies are extremely volatile and may be affected by external factors such as financial, regulatory or political events. Trading on margin increases the financial risks.
Before deciding to trade in financial instrument or cryptocurrencies you should be fully informed of the risks and costs associated with trading the financial markets, carefully consider your investment objectives, level of experience, and risk appetite, and seek professional advice where needed.
Fusion Media would like to remind you that the data contained in this website is not necessarily real-time nor accurate. The data and prices on the website are not necessarily provided by any market or exchange, but may be provided by market makers, and so prices may not be accurate and may differ from the actual price at any given market, meaning prices are indicative and not appropriate for trading purposes. Fusion Media and any provider of the data contained in this website will not accept liability for any loss or damage as a result of your trading, or your reliance on the information contained within this website.
It is prohibited to use, store, reproduce, display, modify, transmit or distribute the data contained in this website without the explicit prior written permission of Fusion Media and/or the data provider. All intellectual property rights are reserved by the providers and/or the exchange providing the data contained in this website.
Fusion Media may be compensated by the advertisers that appear on the website, based on your interaction with the advertisements or advertisers.
© 2007-2025 - Fusion Media Limited. All Rights Reserved.
