I am on record saying the data is forecasting a growing economy. I see NO evidence using any recession forecasting tools (or even the more recent new normal dynamics) which suggest a recession in the near term.
Follow up:
Yet, I continue to look at my conclusions as if they were wrong - and in any event economic conclusions must always be considered suspect as the real knowledge base is closer to voodoo than science. Even so, there is little doubt that an economy which hovers at 2% or less (year-over-year and not headline growth) for long periods of time is ripe for a recession.
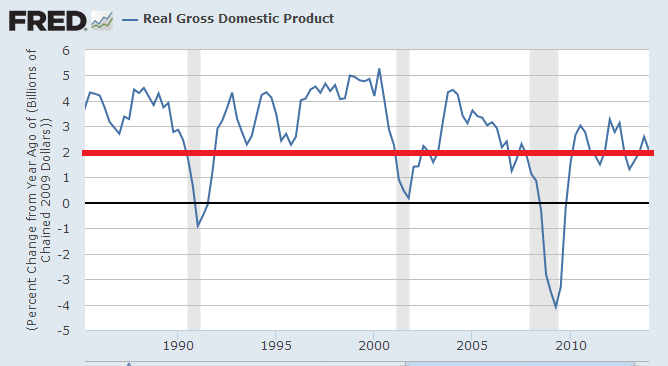
And that is where we are: Year-over-year real GDP growth in the USA has been hovering around 2% for the last year.
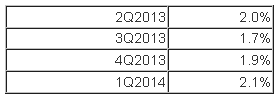
If one uses a four-quarter rolling average of year-over-year real GDP growth, it smooths the lines out making any potential recession easier to spot.
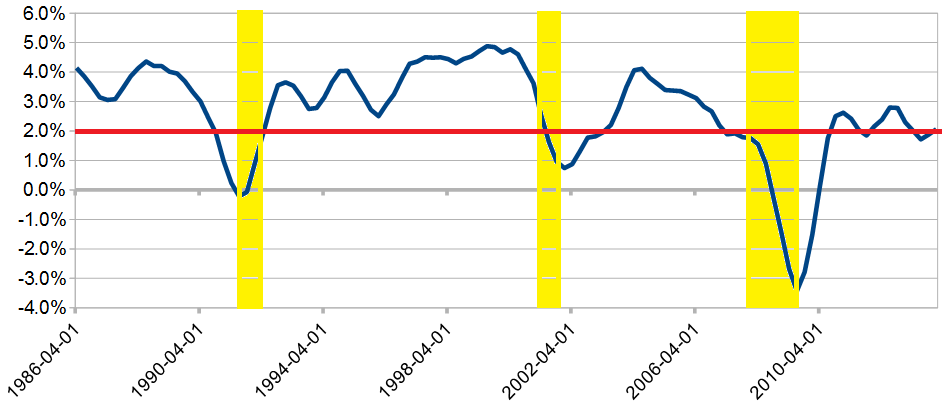
Sounds easy to forecast a recession?? The problem is that GDP is a lagging indicator, any sort of real accuracy lags real time by months, and GDP is never fixed (it is called an estimated value because the estimate is always changed for years and years following the initial release). So what might be obvious today, when looking back using revised historical data, is far from clear in real time - the GDP data is jumping around like Mexican jumping beans.
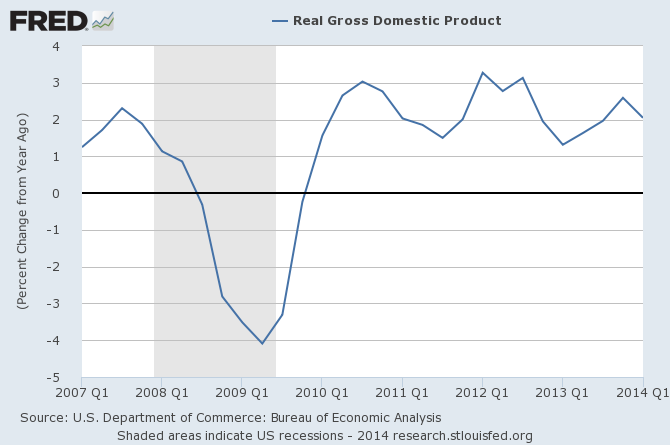
The headline 1Q2014 GDP contraction of 1.0% is misleading. The economic community likes to extrapolate each quarter of GDP as if it were a year of data. This approach creates quite a bit of noise and distortion caused by seasonal adjustment factors (which have not settled down since the Great Reset (aka Great Recession). Although 1Q2014 GDP estimates were far from good, it is far from bad also if the data is analyzed in year-over-year fashion (see graph below):
And if one would look into the detail, 1Q2014 was not that bad. Even with the bad weather cited by some as the cause for weak growth - behind the bad headlines were mechanical issues in the silly way GDP is determined (accounting for GDP at point of production instead of point of final sale or subtracting imports even though imports are a positive for economic activity). The table below breaks down GDP contribution so that you can see that the consumer was still consuming.
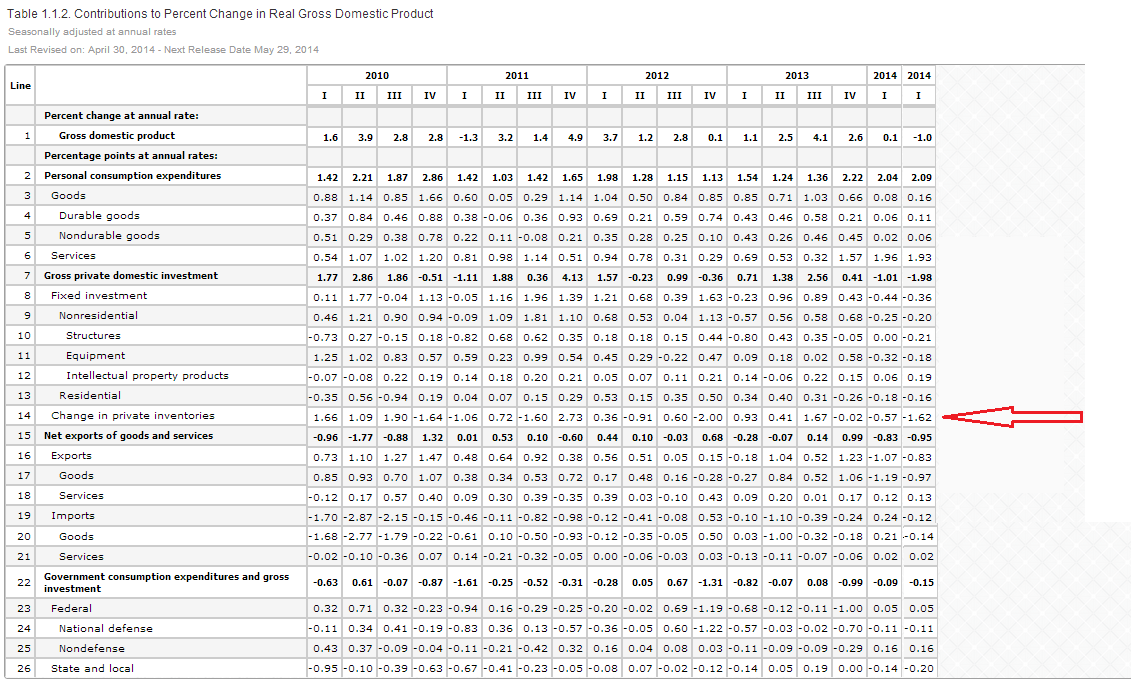
Note that even the drag by the government on GDP will disappear shortly - the further we get away from the end of stimulus and the beginning of austerity. The real economic issue is the lack of investment. So there is no reason to be overly concerned about 1Q2014 GDP. Still, it is concerning when year-over-year real GDP hovers near 2% or less. At 2% it is too easy for a poorly performing economy to trip over a rather insignificant "disruption" - say bad weather or other act of God.
Using pilot speak, 2% is the stick shaker for stall speed.
Other Economic News this Week:
The Econintersect Economic Index for June 2014 is showing continued growth acceleration. Outside of our economic forecast - we are worried about the consumer's ability to expand its consumption as the ratio between income and expenditures are near all time highs. The GDP contraction for 1Q2014 is a paper contraction as GDP is determined by playing games with accounts. No serious element of the economy was in contraction (except government spending) which is already expanding in the 2Q2014.
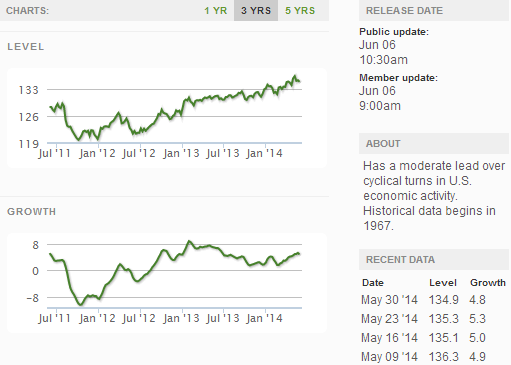
The ECRI WLI growth index value has been weakly in positive territory for many months - but now in a noticeable improvement trend. The index is indicating the economy six month from today will be slightly better than it is today.
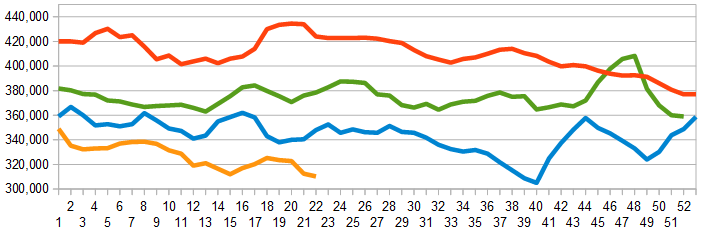
Initial unemployment claims went from 300,000 (reported last week) to 312,000 this week. Historically, claims exceeding 400,000 per week usually occur when employment gains are less than the workforce growth, resulting in an increasing unemployment rate. The real gauge – the 4 week moving average – improved marginally from 312,500 (reported last week as 311,500) to 311,500. Because of the noise (week-to-week movements from abnormal events AND the backward revisions to previous weeks releases), the 4-week average remains the reliable gauge.
Weekly Initial Unemployment Claims - 4 Week Average - Seasonally Adjusted - 2011 (red line), 2012 (green line), 2013 (blue line), 2014 (orange line)
Bankruptcies this Week: Buccaneer Energy Limited
Click here to view the scorecard table below with active hyperlinks
Weekly Economic Release Scorecard:


