Investing.com’s stocks of the week
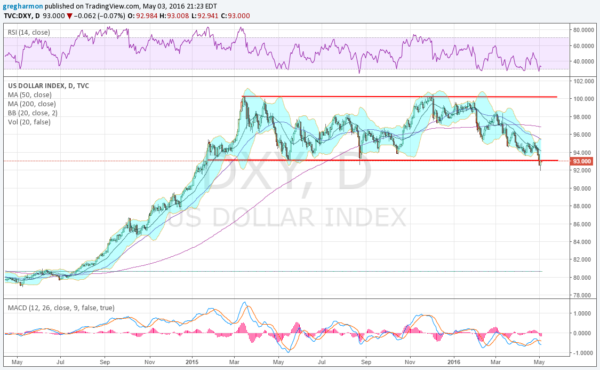
The dollar index started moving higher in July 2015. It did not stop until it had gained 25% in March of 2015. But it seems that may have marked a top. Since then the dollar has moved in a stable 8 point range for 14 months. That was until Tuesday. That is when it broke the range to the downside. IS this the beginning of a retracement lower, or will it have its Rocky moment and rise up off the mat?
The chart below suggests that this time it will be counted out. The momentum is in the bearish range with the MACD falling and the RSI holding a meager bounce off of the oversold level. The Bollinger Bands® are also opening lower to allow a breakdown. And it printed a Death Cross at the end of March. How far can it go? The move up was very rapid, so a move retracing the entire run up from 80 can not be out of the question.

There are but two items in this chart that give a ray of hope for the dollar to hold up and rebound. The first is the candle from Tuesday. A Hammer, it is a potential reversal candle. Should it confirm a reversal by a higher close Wednesday it may get a reprieve. The second is a longer term view. Back in December 2014 I noted that the dollar tended to move in 6 year cycles. If this pattern holds up then this move still has over 4 years to go.
Time will tell. But the next few days and weeks could set many longer term trades in motion.
The information in this blog post represents my own opinions and does not contain a recommendation for any particular security or investment. I or my affiliates may hold positions or other interests in securities mentioned in the Blog, please see my Disclaimer page for my full disclaimer.
