We may be near the trough for the weak data period. There is no analytical basis for this statement - but it does have a basis in logic. After all, the decline in the rate of economic growth began in January 2015 - and we will soon be comparing the current data to the soft 2015 growth.
Follow up:
There never was any sign in the forward looking data this past year of significant slippage in growth - just crappy growth in real time, but growth nonetheless. I personally dismiss GDP as analytical hocus-pocus because it contains elements (e.g. inventory, imports) which provide a smoke screen for the underlying dynamics. Even with this opinion, GDP has been fairly stable (albeit weakening) in 2015 WHEN one steps back and looks at year-over-year growth.
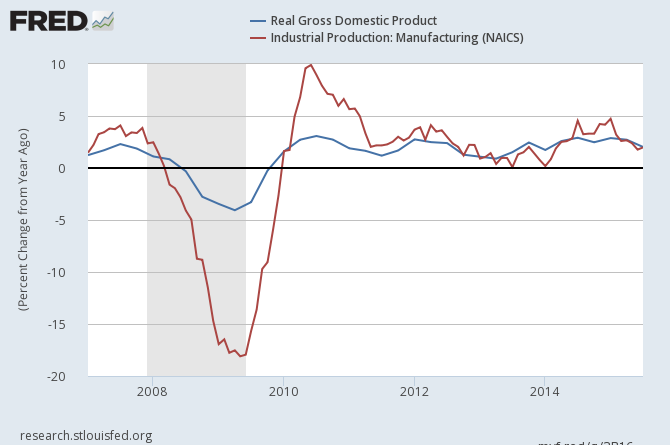
This past week the headlines implied industrial production declined. Industrial production has three parts - manufacturing, mining and utilities. Mining and utilities are in a recession - but manufacturing is chugging along. Econintersect considers manufacturing a significant and timely coincident indicator of the economy. In the above graph which compares the year-over-year growth of GDP (blue line) and manufacturing (red line) - and it is easy to see the relevance of manufacturing to the USA economy.
Comparing Seasonally Adjusted Year-over-Year Change of the Industrial Production Index (blue line) with Components Manufacturing (red line), Utilities (green line), and Mining (orange line)
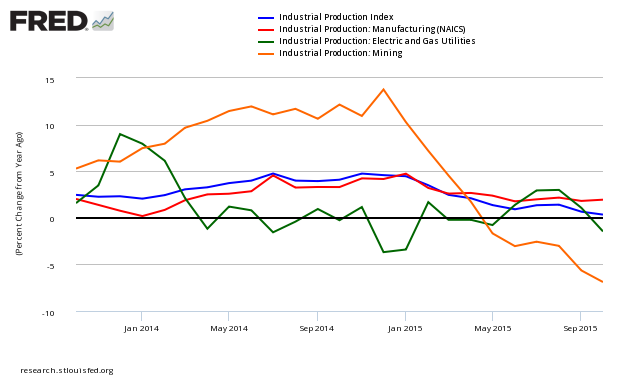
The red line on the above chart is manufacturing - and it continues to show rather stable growth.
Holding this and other surveys Econintersect follows accountable for their predictions, the following graph compares the hard data from Industrial Products manufacturing subindex (dark blue bar) and US Census manufacturing shipments (lighter blue bar) to the various OPINION surveys.
Comparing Surveys to Hard Data:
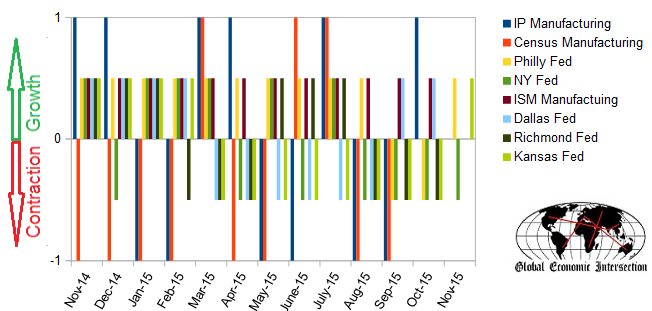
Note that the hard data (Federal Reserves Industrial Production and US Census Manufacturing New Orders) does not agree about half the time (they use different pulse points, methodology, and data universes). And the correlation between the opinion surveys and hard data is inconsistent enough to question the value of the surveys.
My basic belief is that there is little absolute truth. Even data driven analysis can provide the wrong conclusion for a variety of reasons. Opinion is simply opinion and far from fact. One must continue to stand back and try to find some truth in a universe full of conflicting data points. Tea leaves anyone?
Other Economic News this Week:
The Econintersect Economic Index for November 2015 marginally improved - but remains in the low range of index values seen since the end of the Great Recession. The most tracked sectors of the economy generally showed some growth. Still our economic index remains in a long term decline since late 2014. Our employment six month forecast continues to forecast weakening employment growth.
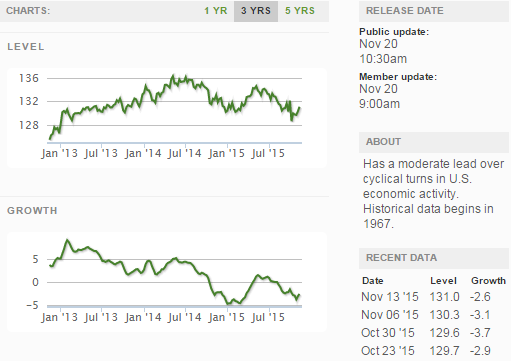
The ECRI WLI growth index is now in positive territory but still indicates the economy will have little growth 6 months from today.
Current ECRI WLI Growth Index
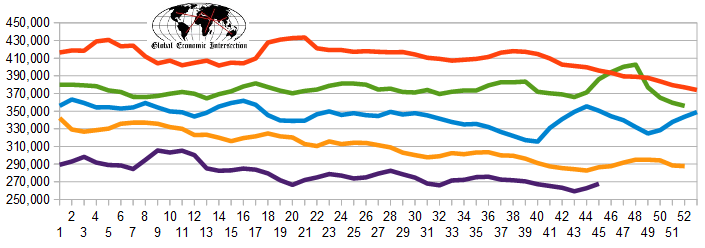
The market (from Bloomberg) was expecting the weekly initial unemployment claims at 265 K to 275 K (consensus 270,000) vs the 271,000 reported. The more important (because of the volatility in the weekly reported claims and seasonality errors in adjusting the data) 4 week moving average moved from 262,750 (reported last week as 262,750) to 270,750. The rolling averages generally have been equal to or under 300,000 since August 2014.
Weekly Initial Unemployment Claims - 4 Week Average - Seasonally Adjusted - 2011 (red line), 2012 (green line), 2013 (blue line), 2014 (orange line), 2015 (violet line)
Bankruptcies this Week: London, England-based OIC Run-Off Limited (pka Orion Insurance Company Limited - Chapter 15), Atna Resources
Click here to view the scorecard table below with active hyperlinks
Weekly Economic Release Scorecard:
