This past week we analyzed the latest BEA release on personal income and expenditure. The bottom line was Joe’s income was up, his spending was down. Joe seems to be marginally hunkering down.
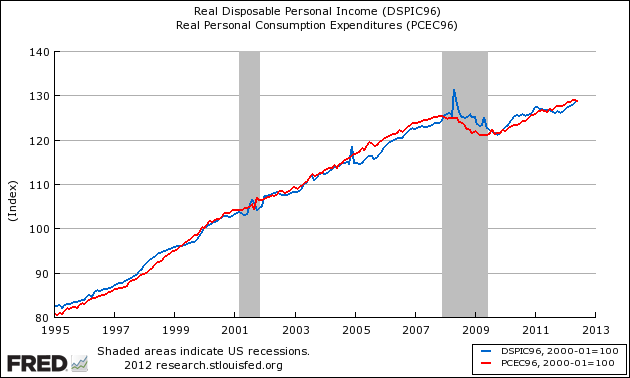
Most of us are Joe Sixpacks, but as all Joe’s are different – it is hard to pinpoint causation of why this happened. The graph below illustrates the relationship between income (DPI) and expenditures (PCE).
Indexed to January 2000, Growth of Real Disposable Income (blue line) to Real Expenditures (red line):

The above graph is indexed, and shows the growth rate between Joe’s income and expenditure have a very high correlation over the long run. The above graph also shows that the economy of the consumer has not stabilized since the Great Recession showing uneven income and expenditure growth.
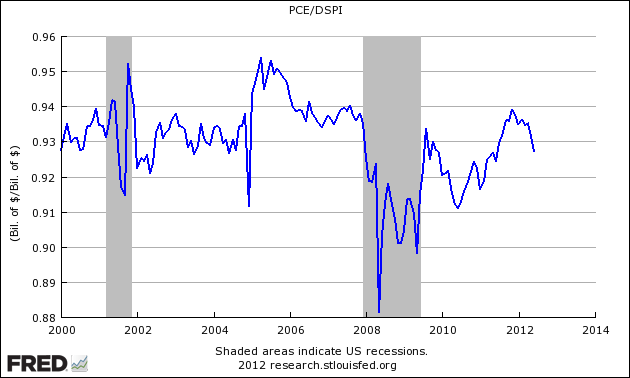
Note: The normalization of both metrics to their January 2000 values allows us to see how each compares to that reference over time: sometimes one is higher vs. the reference month and sometimes the other. It does not reflect that the absolute values are bigger or smaller at different times – DPI is always larger than PCE (on average income is 7% higher than expenditure), as shown in the following ratio graph.
Seasonally Adjusted Spending Ratio to Income (a declining ratio means consumer is spending less of Income):
The consumer between mid-2010 through 2011 was continuing to spend more of his income (and therefore saving less) – but in 2012 this trend has reversed, and now the consumer is spending less of his income.
What we know based on the data is that consumers started spending less of their income beginning in December 2011. And, except for the growth spurt that ended in November 2011, Joe has not returned to his old pre-recession ways. However, after looking stronger than after the 2001 recession the ratio has fallen back to value similar to the first two years following the 2001 recession. The only problem with that is we are now three years after the 2007-09 recession.
My opinion is that this short-term trend is being caused by Joe's uncertainty of future economic conditions. It does not take much delay for decreased consumption to show detrimental economic effects since the consumer is between 2/3 and 3/4 of the economy (depending on what one thinks the economy is).
Joe is spending about 1% less of his income compared to six months ago. A 1% change in Joe's buying habits can move GDP over 0.6%, and could begin a cascade into other portions of GDP.
Hopefully the misleading advertisements of the political candidates will add enough to the economy to overcome the effects of Joe’s uncertainty. On the other hand, this may be what is adding to the uncertainty.
Other Economic News this Week:
The Econintersect economic forecast for August 2012 shows continues to show moderate growth. Overall, trendlines seem to be stable even with the fireworks in Europe, and emotionally cannot help thinking this is the calm before the storm. There are no recession flags showing in any of the indicators Econintersect follows which have been shown to be economically intuitive. There is no whiff of recession in the hard data – even though certain surveys are at recession levels.
ECRI stated in September 2011 a recession was coming, and now says a recession is already underway. The size and depth is unknown. A positive result is this pronouncement has caused much debate in economic cyberspace.
The ECRI WLI index value remains in negative territory – but this week is again “less bad.” The index is indicating the economy six months from today will be slightly worse than it is today. As shown on the graph below, this is not the first time since the end of the Great Recession that the WLI has been in negative territory, however the improvement from the troughs has been growing less good.
Current ECRI WLI Growth Index:
Initial unemployment claims increased from 353,000 (reported last week) to 365,000 this week. Historically, claims exceeding 400,000 per week usually occur when employment gains are less than the workforce growth, resulting in an increasing unemployment rate (background here and here). The real gauge – the 4-week moving average – declined from 367,250 (reported last week) to 365,500. Because of the noise (week-to-week movements from abnormal events AND the backward revisions to previous weeks' releases), the 4-week average remains the reliable gauge.
Weekly Initial Unemployment Claims – 4 Week Average – Seasonally Adjusted – 2010 (blue line), 2011 (red line), 2012 (green line):
Data released this week which contained economically intuitive components (forward looking) were:
- Rail movements (where the economic intuitive components continue to be indicating a moderately expanding economy – however recent movements are showing an economy growing barely more than 1%).
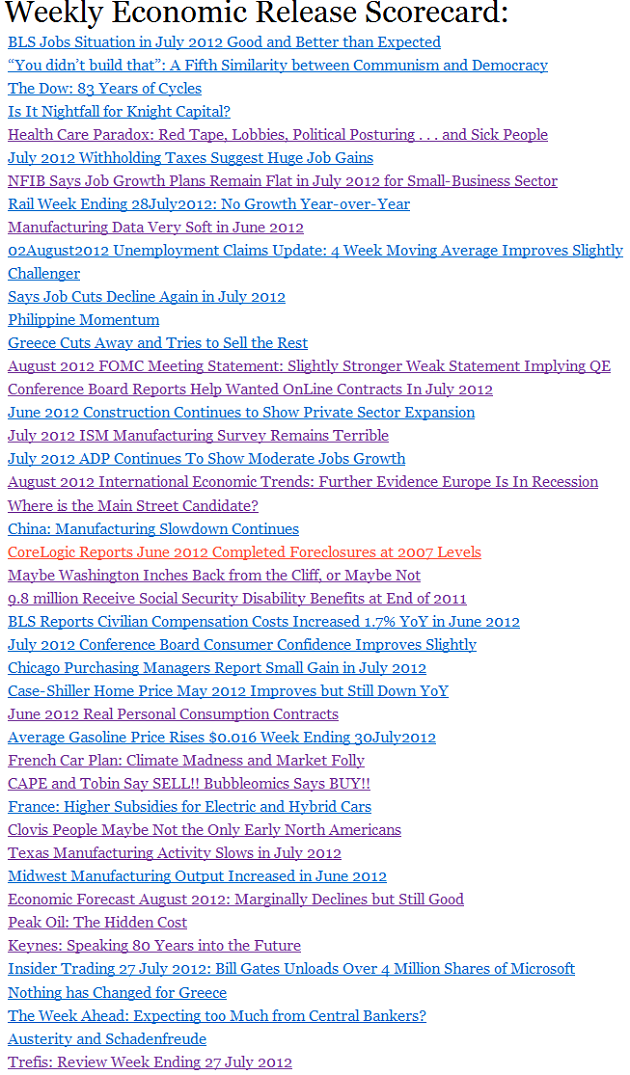
Weekly Economic Release Scorecard:
Click here to view the scorecard table below with active hyperlinks.

Bankruptcies this Week: Digital Post Interactive, Neogenix Oncology, Curaxis Pharmaceuticals, The City of San Bernadino (California)
