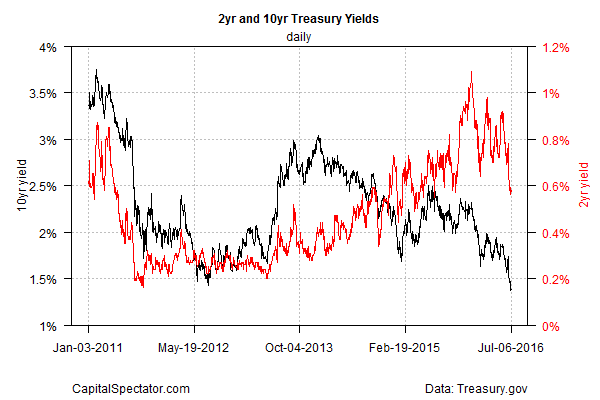
After dipping to a record low of 1.37% on Tuesday, the benchmark 10-year Treasury yield ticked higher yesterday (June 6), settling at 1.38%, based on daily data from Treasury.gov.
Has the downside bias run its course? The answer awaits in the incoming economic data. Meantime, recent US numbers are sending mixed signals and new questions raised in the post-Brexit world order aren’t helping.
The main event for this week is Friday’s US employment report. The stakes are high in the wake of the dramatic slowdown in job growth in May. But economists are looking for a solid rebound in June. Private-sector payrolls are projected to grow by 170,000, according to Econoday.com’s consensus forecast for Friday’s release—a hefty U-turn after May’s stall-speed rise of just 25,000.
If the prediction holds, the crowd will breathe a collective sigh of relief and write off the weak May data as noise. If the employment report disappoints, on the other hand, it may be time to prepare for another leg down in the 10-year yield.
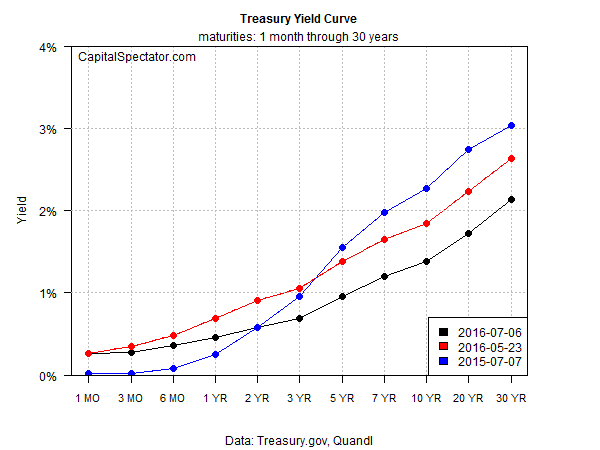
The latest slide in rates, combined with the Fed’s modest rate hike in December, has produced a flatter yield curve. In fact, yesterday’s 10-year/3-month Treasury yield spread, at just 1.11 percentage points, is the lowest since 2008 (excluding Tuesday’s 1.05 spread).
Negative 10-year/3-month spreads are considered a sign that recession risk is high and so further declines in the weeks ahead will fuel concern that the macro trend in the US is slipping into the red.
The alternative view is that this time is different. With even lower yields elsewhere in the world, Brexit-related jitters have inspired a fresh run into Treasuries, which still offer a comparatively attractive yield vs., say, the modestly negative rate for a German 10-year bond.
Mohamed El-Erian, chief economic adviser at Allianz SE, advises that the relative allure of US yields is the key factor that’s driving rates lower.
This notable decline in Treasury yields is not following a conventional path, particularly as it says a lot more about Europe and Japan than about the U.S.
Traditionally, lower yields and a flatter yield curve in the U.S. are strong signals of an approaching recession — and, in this particular case, they would be signaling a painful downturn, given how far yields have dropped and how flat the curve has become.
Yet that reading doesn’t apply in this case: Rather than being driven by U.S. conditions, the Treasury yield curve has been captured by developments in Europe and, to a lesser extent, Japan — specifically, the prospects for yet another economic slowdown and the likelihood of additional central bank stimulus (including lower rates in the U.K. and an expansion of the European Central Bank’s large-scale program of security purchases).
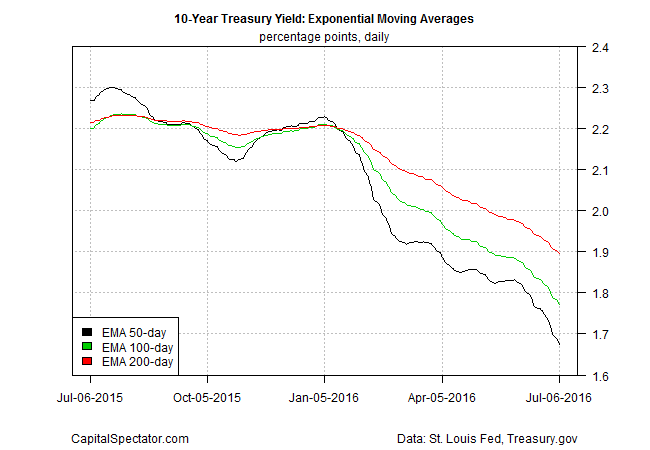
Whatever the source of the yield slide, the downside momentum looks set to endure, or so a set of exponential moving averages (EMAs) suggest. Note that the 50-day EMA for the 10-year yield is below its 100-day EMA and both are well below the 200-day EMA.

Short of a convincing run of strong economic reports in the weeks ahead, the 10-year yield will have a tough time breaking free of the gravity factor that’s pulling rates everywhere ever lower.


