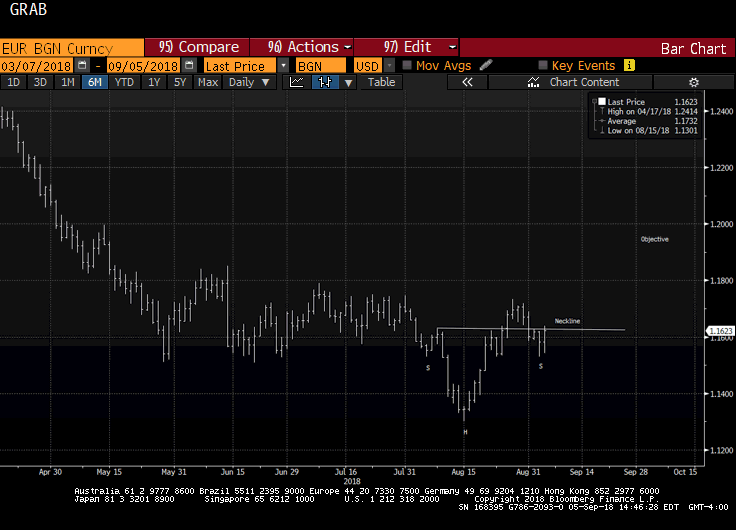
The euro recorded the low for the year so far on August 15 near $1.13. We had been anticipating a corrective phase for a couple days before the low was recorded. Recall that the previous Friday, August 10, all the major currencies, but the Japanese yen and Canadian dollar were beyond their Bollinger Bands.

The euro recovered toward $1.1735 on August 28, stopping shy of our initial objective of $1.1750. Yet through the euro's bounce, the net speculative position in the futures market, a proxy for momentum players and trend followers, continued to move against the euro. Specifically, there was a net long speculative position of 29.6k contracts at the end of July. Speculators went net short euros in the middle of August for the first time since April 2017 and last week's report showed the net short position has increased to 7.2k contracts by the August 28.
The gross short speculative position rose from 151.7k contracts at the end of July to 193.7k contracts as of August 21 before easing to 178.6k the following week. It was the first week in five that short positions were pared.
The euro pulled back from the August 28 high to reach $1.1530 on September 4. It matched the low from August 23. Today's high met the 61.8% retracement objective that near-term decline. A move above $1.1660 could sput a move back to the $1.1735-$1.1750 area.
The Great Graphic shows a somewhat different take. It depicts a possible head and shoulders bottom in the euro. The head was set near $1.13, and the neckline is found around $1.1625. It is not unusual for the neckline to be penetrated and then retested. The euro's losses last week are a bit more than ideal, but the shoulders ( ~$1.1530) held.
The importance of the technical patterns lies in the measuring objective generated. The initial objective of the head and shoulders pattern is found by rotating the pattern on the neckline. In this case, the objective is near $1.1950. That area is important from a technical perspective. The 50% retracement of the euro's decline since the February high near $1.2555 is found close to $1.1930. The 200-day moving average is found now around $1.1955. If the euro has a double bottom at $1.1530 and it goes through $1.1735, the measuring objective is near $1.1940.
The market had a good reason to sell the euro off, and it hasn't. Yesterday's denial of a deal between the UK and Germany could have led to a deeper setback. Today's disappointing German factory orders could have also provided incentives to euro bears. The euro's resilience is notable.
What would negate this constructive technical outlook? A break below $1.1530 would undermine the chart patterns. A close below $1.1570 would raise a yellow flag.
To avoid confusion, let us reiterate that the technical scenario sketched here is a near-term technical move. Our medium-term dollar outlook remains constructive. It is informed by the policy mix and interest rate differentials that draws the world's saving to the United States.
