Many investors like to look for value in stocks, but this can be very tough to define. There is great debate regarding which metrics are the best to focus on in this regard, and which are not really quality indicators of future performance. Fortunately, with our new style score system we have identified the key statistics to pay close attention to and thus which stocks might be the best for value investors in the near term.
This method discovered several great candidates for value-oriented investors, but today let’s focus on Societe Generale (PA:SOGN) Group (OTC:SCGLY) as this stock is looking especially impressive right now. And while there are numerous reasons why this is the case, we have highlighted three of the most vital reasons for SCGLY’s status as a solid value stock below:
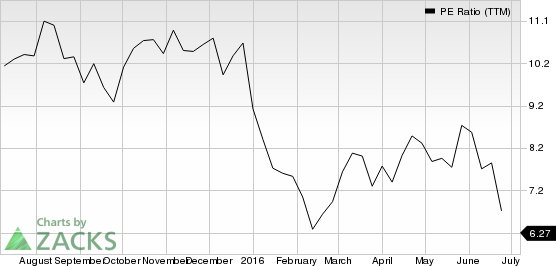
Forward PE for Societe Generale
Easily one of the most popular readings for value investors, the forward PE ratio shows us the current price of a stock divided by the full year earnings. Generally speaking, value investors like to see this ratio below 20, though it can vary by industry.
Right now, SCGLY has a forward PE of just 6.85, which means that investors are paying $6.85 for each dollar in expected Societe Generale earnings this year. Compared to the industry at large this is pretty favorable as the overall space has an average PE of 10.23 in comparison.
Price/Cash Flow for Societe Generale Stock
An often overlooked ratio that can still be a great indicator of value is the price/cash flow metric. This reading is preferred by some since it avoids amortization and depreciation concerns and can give a more accurate picture of the financial health in a business.
The P/CF ratio for SCGLY comes in at 2.69, and since investors are generally looking for a reading under 20 here, this is pretty good news. Meanwhile, we should also point out that the industry average for this metric is 4.69, so Societe Generale has its peers beat in this regard too.
SCGLY Earnings Estimate Revisions Moving in the Right Direction
The solid value ratios outlined in the preceding paragraphs might be enough for some investors, but we should also note that the earnings estimate revisions have been trending in a positive direction as well. Analysts who follow SCGLY stock have been raising their estimates for the company lately, meaning that the EPS picture is looking a bit more favorably for Societe Generale now.
Over the past 60 days, 1 earnings estimate has gone higher compared to none lower for the full year. This revision has helped to boost the consensus estimate, as 60 days ago, SCGLY was expected to post earnings of 84 cents per share for the full year, though today it looks to have EPS of 87 cents for the full year.
Bottom Line
For the reasons detailed above, investors shouldn’t be surprised to read that we have SCGLY as a stock with a Value Score of ‘A’ and a Zacks Rank #2 (Buy). So if you are a value investor, definitely keep SCGLY on your short list as this looks to be a stock that is very well-positioned for gains in the near term.
Want the latest recommendations from Zacks Investment Research? Today, you can download 7 Best Stocks for the Next 30 Days. Click to get this free report >>
SOCIETE GENL FR (SCGLY): Free Stock Analysis Report
Original post

