
Silver’s explosive move higher has everybody talking about it. Surely it must be a blow-off top and be ready to come down in flames. Many will provide a myriad of opinions and reasons on why that crash is supposed to happen, but few bother to look at the price charts. In the end, price is the final arbiter, and opinions are for cocktail parties.
Elliott Wave Theory is purely price-based and is probability-based. Hence, it is one of the better tools to assess the “what’s next” question. But nothing should be used in isolation, so I prefer to look at the technical indicators (TIs) as well. Do they support my preferred Elliott wave option or the alternate?
In this update, I will look at two ETFs, Global X Silver Miners ETF (NYSE:SIL) and iShares Silver Trust (NYSE:SLV), to try to determine what is most likely next for these two instruments.
Figure 1, SIL daily chart.
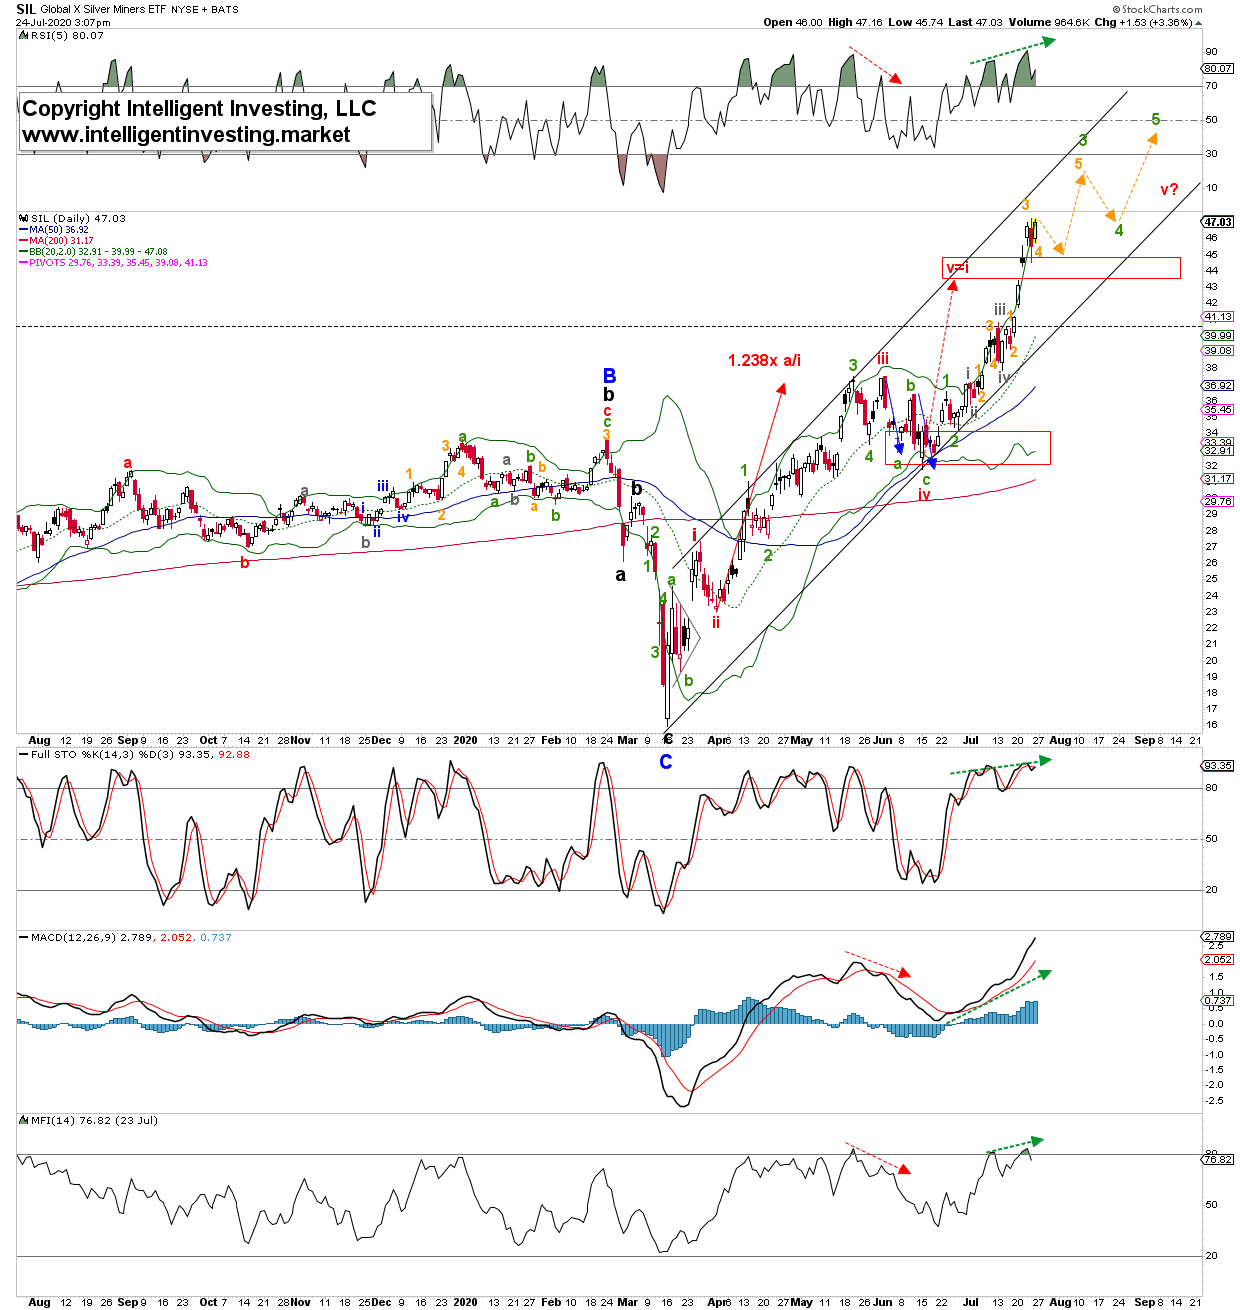
Figure 1 above shows SIL is in an impulsive move higher since the March low. It is now ideally wrapping up several smaller (orange and green) 4th and 5th waves to around the mid-50s before putting in a more significant top. Note the technical indicators (RSI5, FSTO, MACD and MFI) are rising with price (green dotted arrows) supporting the Elliott wave count for higher prices. There needs to be negative divergence like from late-May to early-June to usher in a more significant correction. The horizontal black dotted line shows the cut-off for the displayed Elliott wave count, i.e., the instrument will have to move and close below it, from current levels, to negate the Bullish potential. Quite a ways to go.
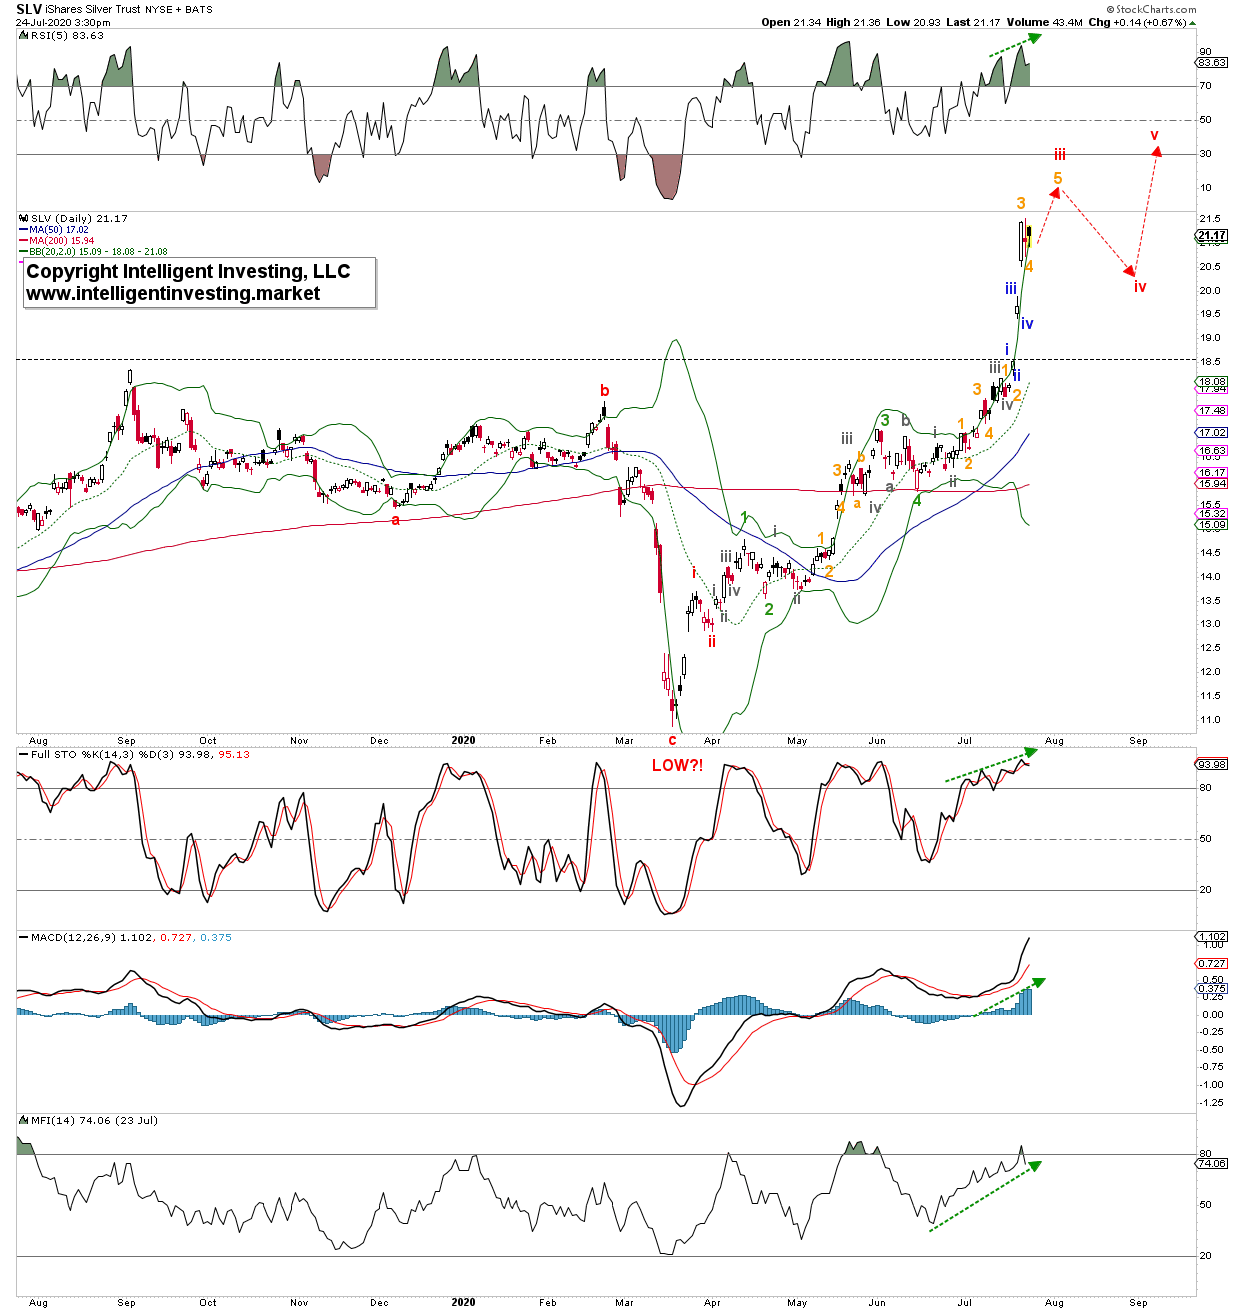
Figure 2 below shows SLV.
The Elliott wave count would also like to see more upside. Like SIL, albeit slightly different, several more 4th and 5th waves are preferably needed before a more meaning full correction starts. The dotted arrows show the anticipated path forward. Like SIL, the TIs are not negatively diverging and have kept rising with price (green dotted arrows): thus, expect higher prices.
Negative divergence is needed to at least warn us of a more significant correction than the sideways price action over the last two days. The ideal upside target for SLV would be the mid-20s.
Figure 2, daily chart.
Bottom line: Although the most substantial gains of the current rally are most likely already behind us, the Elliott wave counts and technical indicators support more upside for SIL and SLV. I expect several more up and down moves (4th and 5th waves) before a more significant correction unfolds. This correction will likely be a great buying opportunity for the long-term investors, while the next few days and weeks will be good from a trading perspective due to the anticipated 4th and 5th wave swings.