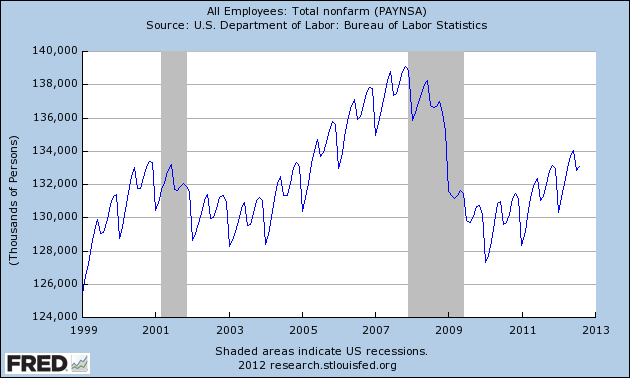
Next week, the BLS will issue the Jobs Report – the last one before the usual holiday hiring season begins. Jobs growth is seasonal – and most are so attuned to the seasonally adjusted data that they do not grasp employment dynamics. Looking at the unadjusted data, the real jobs growth is in February, March and April. After April, there are ups and downs of jobs growth, culminating with a pick up before Christmas. But come January, all that jobs growth is eliminated, and the real jobs level returns to the employment gains between the March and April levels.
In other words, historically the end-of-year holiday hiring is simply employment statistical porn as all the jobs gained are lost in late December / January, as the following graph demonstrates.
Of course recessions play havoc with historical relationships – but, if this year is normal, the unadjusted non-farm jobs growth for 2012 will be between 1.8 (January to March Jobs growth) and 2.6 million (January to April Jobs growth). Last year (2011) the growth was nearly 1.8 million with January to March Jobs growth at 1.7 million and the January to April Jobs growth at 2.9 million.
This past week Challenger, Gray & Christmas, Inc. predicted better jobs growth over the 2012 holiday season.
“The economy has continued its slow recovery and surveys of retailers show that they are hopeful for solid sales gains this year. However, recent consumer confidence readings have been relatively week and unemployment remains stubbornly high. The mixed picture is likely to compel retail employers to proceed cautiously when it comes to hiring extra workers for the holiday season. Look for many to start at last year’s levels and hire additional workers only if strong sales early in the season warrant it,” said John A. Challenger, chief executive officer of Challenger, Gray & Christmas.
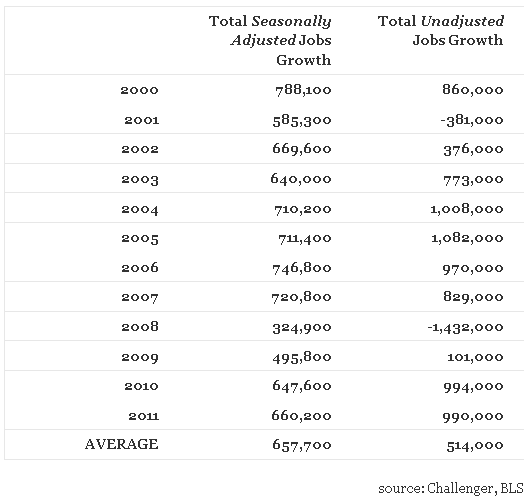
“Last year, retailers added just over 660,000. This year, that figure could approach 700,000. There is still too much uncertainty to expect seasonal employment gains to reach the level we saw in 2006, when retailers added nearly 747,000 extra workers at the end of the year. We may never again reach the level of hiring achieved in 1999, at the height of the dot.com boom, when nearly 850,000 seasonal workers were added,” he added.
Challenger included the seasonally adjusted holiday season jobs growth numbers, and for grins I have provided the unadjusted numbers.
Total Non-Farm Jobs Growth for Three Months (October, November, December) 
My takeaway is that the BLS seasonal adjustments is causing a distortion in understanding employment dynamics. The unadjusted numbers are showing jobs growth in 2010 and 2011 are indeed as good as 2006 – and 2010 and 2011′s growth is high historically.
Of course every job gained is important – even if it is temporary. It is likely Santa Claus will bring 1 million jobs this coming holiday season, and for that we should be thankful.
Other Economic News this Week:
The Econintersect economic forecast for September 2012 shows moderate growth continuing. Overall, trend lines seem to be stable even with the fireworks in Europe, and poor data from China. There is a whiff of recession in the hard data – excluding certain surveys are at recession levels – with container imports contracting for two months in a row.
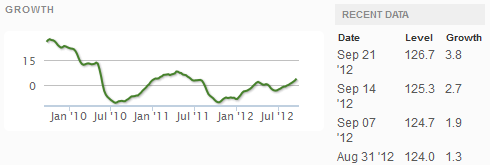
ECRI is still insisting a recession is here (a 07 Sep. 2012 post on their website). ECRI first stated in September 2011 a recession was coming. The size and depth is unknown. The ECRI WLI growth index value improved this week enjoying its fifth week in positive territory. The index is indicating the economy six month from today will be slightly better than it is today. 
Initial unemployment claims declined moderately – from 382,000 (reported last week) to 359,000 this week. Historically, claims exceeding 400,000 per week usually occur when employment gains are less than the workforce growth, resulting in an increasing unemployment rate (background here and here). The real gauge – the 4 week moving average – fell slightly from 377,750 (reported last week) to 374,000. Because of the noise (week-to-week movements from abnormal events AND the backward revisions to previous weeks releases), the 4-week average remains the reliable gauge.
Weekly Initial Unemployment Claims – 4 Week Average – Seasonally Adjusted – 2010 (blue line), 2011 (red line), 2012 (green line) 
Data released this week which contained economically intuitive components(forward looking) were
- Rail movements (where the economic intuitive components continue to be indicating amoderately slightly expanding economy)..
All other data released this week does not have enough historical correlation (foresight) to the economy to be considered intuitive, or is simply a coincident indicator to the economy.
Click here to view the scorecard table below with active hyperlinks.
