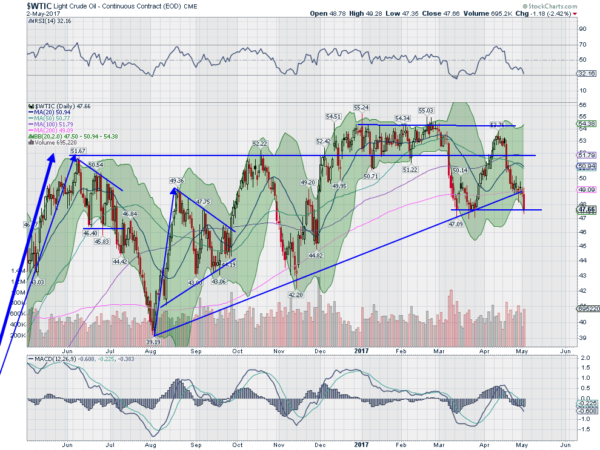
Last week here we pondered whether the fall in Oil prices was over. There were signs of a bottom as the price sat at support and the 200 day SMA. But there was also a dark side that suggested further weakness might bring a collapse in Oil prices. The latter perspective has since take control and prices are now at a critical juncture.
The chart below shows the breakdown out of an ascending triangle earlier this week. That gives a target to 36.50. It now sits at support from March near 48. A drop below wold make for a lower low after a fall from a lower higher, the beginning of a downtrend. Momentum has grown deeply bearish. The RSI is near 30. this oddly could be what stops the fall in prices. As the RSI has hit this level last August, November and in March Oil prices have found support and reversed.

But at each of those bottoms in the RSI the MACD has been at an extreme low level as well. It is not anywhere near that extreme now. This gives a bias to more downside. Perhaps another weak RSI bounce like in November and a return lower allowing more downside in Oil prices. Below 48 there is possible support at 45.25 and 44.50 followed by 43.25 and 41.20 before.
A reversal higher does not preclude more downside yet either. Often a break down reverses and retests the break level, this would be at 49. It would take a move back over 49 to end the downside watch for now. Until then the bias is for lower Oil prices. Keep an eye here.
The information in this blog post represents my own opinions and does not contain a recommendation for any particular security or investment. I or my affiliates may hold positions or other interests in securities mentioned in the Blog, please see my Disclaimer page for my full disclaimer.
