During the final week of February, the prices of markets across all asset classes fell in risk-off trading conditions and natural gas was no exception. In the last trading session of the second month of 2020, the price of natural gas fell to a new low at $1.642 per MMBtu, only 3.1 cents above the March 2016 low and 3.2 cents over the 1998 bottom in the energy commodity.
Before breaking the $1.70 level, the low had been $1.753, which gave way to a recovery that took the price of nearby NYMEX futures to a high of $2.025. Natural gas did not stay above the $2 level for long on February 20, as selling emerged to push the price to another in a long series of lower lows.
The path of least resistance of the energy commodity has been consistently lower since the beginning of the 2019/2020 peak season in early November 2019. On Thursday, March 5, the Energy Information Administration released its latest data on stockpiles, which were far from bullish. Stocks are significantly higher than over the previous year's with the end of the peak season in the coming weeks. Meanwhile, the move to recent low below $1.65 triggered another recovery that has taken the price of the energy commodity back to the $1.80 per MMBtu level. The United States Natural Gas Fund (NYSE:UNG) tracks the price of nearby natural gas futures higher and lower.
The Market Expected A Withdrawal Of 126 bcf
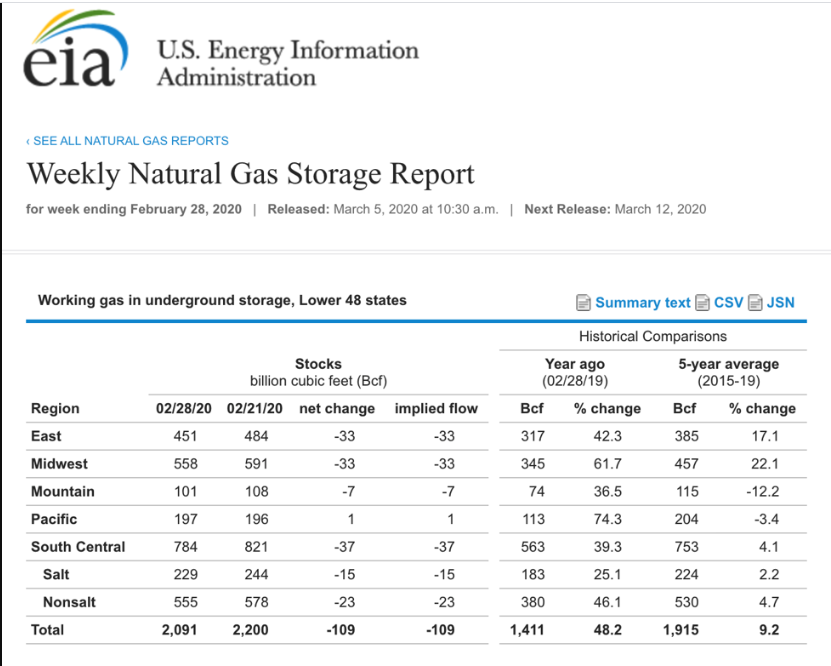
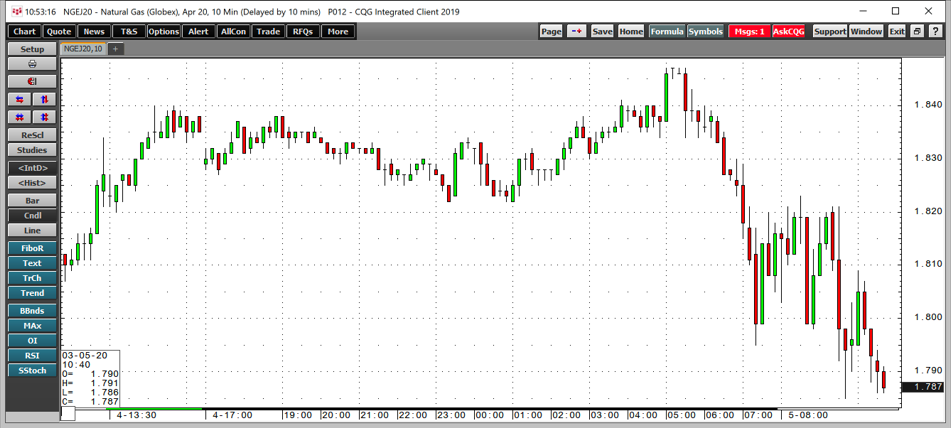
According to Estimize.com on March 4, the consensus estimates for the EIA data for the week ending on February 28 was for a decline in the amount of natural gas in storage around the United States of 126 billion cubic feet. The price was sitting around the $1.80 per MMBtu level on the April NYMEX futures contract before the EIA data release. After trading down to a new low at $1.642 on February 28, the price recovered to a high of $1.847 on March 5 before the market heard from the EIA.

(Source: EIA)
The chart highlights that the withdrawal came in a bit below the market’s expectations at a decline of 109 billion cubic feet. Total stockpiles in storage stood at 2.091 trillion cubic feet for the week ending on February 28, which was 48.2% above last year’s level and 9.2% above the five-year average for the end of February.

(Source: CQG)
The chart shows that the smaller withdrawal weighed on the price of natural gas, which was back below the $1.80 per MMBtu level.
Three Weeks Before Injection Season Begins
The beginning of March signals that spring is on the horizon. In the natural gas market, there are likely three weeks left until withdrawals end, and injections into storage begin to build inventories in the US. In 2019, stockpiles dropped to 1.107 trillion cubic feet at the end of the peak season for demand. With stocks at 2.091 tcf at the end of February, they will be at a significantly higher level at the end of the peak season of demand in 2020 compared to 2019. Stocks would need to decline by an average of 328 bcf over the next three weeks to reach last year’s low, which is impossible given that the most substantial decline so far this season was at 201 bcf in January. While it is always possible that a final blast of cold weather lifts demand in March, withdrawals typically tail off at the end of the season. We are likely to wind up with around 1.8 tcf as injections begin, which would be almost 700 bcf higher than last year.
The bottom line is that the inventories going into the offseason for demand are at a level that could encourage selling and lower lows.
Price Edges Higher: Risk-Off Action In All Markets
While supply and demand fundamentals continue to point to lower prices, risk-off conditions could cause market participants that would ordinarily sell on any rally to remain on the sidelines.
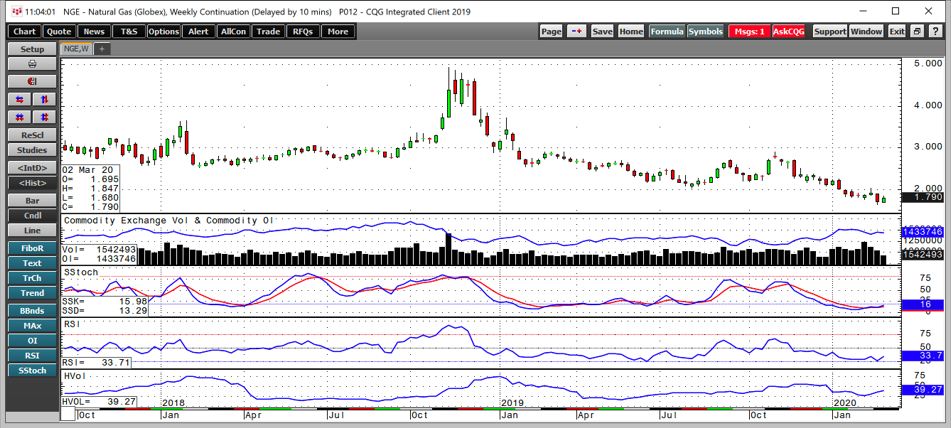
The trend in natural gas has been bearish, with selling on every attempt at a price recovery since November 2019.

(Source: CQG)
The weekly chart shows that both price momentum and relative strength indicators are in oversold territory. Weekly historical volatility has increased from below 28% in mid-February to almost 40% on March 5. Meanwhile, the total number of open long and short positions at 1.434 million contracts on March 4 is significantly higher than last year at this time when open interest stood at 1.192 million. The metric was over 240,000 contracts higher on a year-on-year basis, which is a sign that natural gas still has a substantial number of speculative positions. Since the trend has been bearish, there is likely an overabundance of short positions.
Perhaps the most bullish factor for the natural gas market could be another round of risk-off behavior in all markets, which causes speculators to move to the sidelines in natural gas. Risk-off translates to exiting positions, which does not necessarily mean selling. In natural gas, continued market volatility could lead to buying and a price recovery.
Watch that open-interest metric for clues.
The United States Natural Gas Fund L.P. was trading at $13.80 per share on Thursday afternoon, down $0.39 (-2.75%). Year-to-date, UNG has declined -40.82%, versus a 13.96% rise in the benchmark S&P 500 index during the same period.
UNG currently has an ETF Daily News SMART Grade of C (Neutral), and is ranked #51 of 109 ETFs in the Commodity ETFs category.
