Unless one is off the grid, political ads resonate through the media. The one issue on which the two political camps disagree is whether the voters are better off than they were when the current administration took office.
Depending on how one slices and dices the data, different (and diametrically) opposed conclusions can be drawn. It also depends on where you stand in the economic food chain.
It is time to look at Joe Sixpack’s world.
So one does not think this is some disguised political post – I will disclose I dislike equally both of the major political party candidates running for office – and do I believe either candidate will be good for the economy. From an economic point of view, both have misrepresented significantly what has happened, what is going on right now, and what their policies will accomplish.
To begin, one needs to define Joe Sixpack. Urban dictionary defines Joe:
Average American moron, IQ 60, drinking beer, watching baseball and CNN, and believe everything his President says.
This definition is bull crap. Too many of us think we are smarter than Joe – and are above Joe in the social order. Hello, most of us are Joe. Per Wikipedia:
John Q. Public (and several similar names; see the Variations section below) is a generic name in the United States to denote a hypothetical member of society deemed a “common man.” He is presumed to represent the randomly selected “man on the street.” Similar terms include John Q. Citizen and John Q. Taxpayer, or Jane Q. Public, Jane Q. Citizen, and Jane Q. Taxpayer for a woman. The name John Doe is used in a similar manner. For multiple people, Tom, Dick and Harry is often used. Roughly equivalent are the names Joe Six-pack, Joe Blow, the nowadays less popular Joe Doakes and Joe Shmoe ….
Almost all Americans who MUST work to survive are Joes. Americans who are relying on some level of earned income during retirement are Joes. I believe anyone who sees themselves as middle class (educated or not – professional or blue collar) is a Joe. Joe is somewhere around average American:
- Joe’s median family unit spends or makes about $50K per year
- Joe’s median net worth was $120K in 2007
By definition over 50% of American’s are Joes. The question is whether Joe is better off today, but the answer depends on the starting point. Consider that the economy does not turn on a dime, and it was in a free fall when President Obama took office. Good economic decisions made in 2009 may or may not be apparent yet. In other words, it is not fair to ask the question whether Joe is better off today than 4 years ago – but whether Joe’s tomorrow will be better.
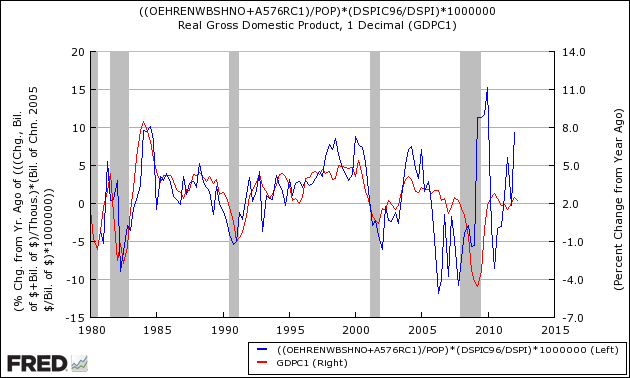
In July 2012, Econintersect introduced the Joe Sixpack Index which is a composite index of home prices and wage income. Since 2010, this index has been trending up (even though income has been flat) due to home price decline moderating and then clearly improving. Unfortunately:
- The data in this index is only updated every three months, but because home prices are continuing to improve we know the values are higher than shown on the below graph.
- The First Time Home Buyer’s Stimulus (caused by Bush era legislation) spike in 2009 distorted the index
Joe Sixpack Index (blue line, left axis)
If home prices keep improving – the Joes who own houses will be better off in the future. We can argue:
- whether the $300 billion home stimulus actually did any good;
- if the President of the USA has any control over home prices when Congress passes the laws relating to home ownership, and the Federal Reserve influences borrowing rates with its monetary policy.
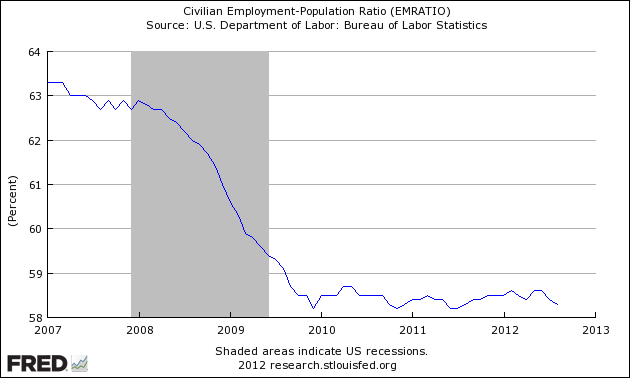
Jobs are another issue. As most know, I massively dislike the way the BLS presents the employment picture – and this allows the pundits and political candidates alike to spin the employment picture any which way. Fox News provides a recent example of spin. I have consistently cut through the haze telling you the jobs situation is not improving. 
This simple approach to overview employment tells you that since the end of the recession – even with the “massive” stimulus – Joes are not doing any better on the employment front. Employment / population ratios adjust for population growth, and the percent of the population working has been unchanged for the last 3 years. Hence, the employment picture is stable – and if we project the trend lines going forward, Joe or his kids cannot look forward to any improvement.
We can argue:
- about what the President can do to spur employment as most of the laws and regulations which are headwinds to jobs growth came from Congress;
- in the recent period, it could be argued that the opposition party blocked jobs legislation. Small business is the historical creator of jobs, and this pundit believes the proposed legislation was political in nature, and little help going to small business. My position is that small business needs relief from regulation to initiate a growth spurt – of course, tax relief would be additional icing (although Congress has historically mishandled stimulus).
My view is that Joe has nothing to look forward to in jobs (no matter who is elected) based on the proposals put on the table (which require Congressional approval anyway – good luck on that one). It is Congress who is the villain here, because the solutions will take years to manifest and they want results in one election cycle (2 years).
Whoever is President in 2013 will have the luck of improving home prices to make Joe feel a little better.
In any event, Joe will be screwed by the next President in entitlements such as social security and medicare. Both political parties feel a (more) balanced budget is mandatory, and entitlements are the entire cause of the over-run going forward. There are a number of debates going on about the relative importance of that topic at the present juncture. I will steer clear of that.
Sorry Joe. I think you will lose no matter who wins. The winners as usual will be the politicians, the 0.001%, the delusional, lottery winners, and the ideologues who would not know truth if they tripped over it.
Other Economic News this Week:
The Econintersect economic forecast for September 2012 shows moderate growth continuing. Overall, trend lines seem to be stable even with the fireworks in Europe, and poor data from China. An emotional component of my mind cannot help thinking this is the calm before the storm. But a logical component in the same cranium sees there are no recession flags showing in any of the indicators Econintersect follows which have been shown to be economically intuitive. There is no whiff of recession in the hard data – even though certain surveys are at recession levels.
ECRI is still insisting a recession is here (a 07Sep2012 post on their website). ECRI first stated in September 2011 a recession was coming . The size and depth is unknown. The ECRI WLI growth index value improved this week enjoying its third week in positive territory. The index is indicating the economy six month from today will be slightly better than it is today.
Current ECRI WLI Growth Index 
Thursday, Lakshman Achuthan, chief operations officer of the Economic Cycle Research Institute, appeared on Bloomberg TV to reaffirm the recession is here. Lakshman continues to claim the economic elements the NBER uses to call a recession have rolled over, which will only be true if the current data is backwardly revised. Please see Econintersect’s economic forecast to see their current situation.
Initial unemployment claims declined from 365,000 (reported last week) to 382,000 this week. Historically, claims exceeding 400,000 per week usually occur when employment gains are less than the workforce growth, resulting in an increasing unemployment rate (background here and here). The real gauge – the 4 week moving average – rose slightly from 371.250 (reported last week) to 375,000. Because of the noise (week-to-week movements from abnormal events AND the backward revisions to previous weeks releases), the 4-week average remains the reliable gauge.
Weekly Initial Unemployment Claims – 4 Week Average – Seasonally Adjusted – 2010 (blue line), 2011 (red line), 2012 (green line)
Data released this week which contained economically intuitive components (forward looking) were
- Rail movements (where the economic intuitive components continue to be indicating a moderately expanding economy).
- The import portion of the trade balance continues to show the USA economy will moderately improve.
- The manufacturing portion of Industrial Production was soft this month, but still expanding. One month is not a trend, and part of the softness is due to the hurricane.
All other data released this week does not have enough historical correlation to the economy to be considered intuitive, or is simply a coincident indicator to the economy.
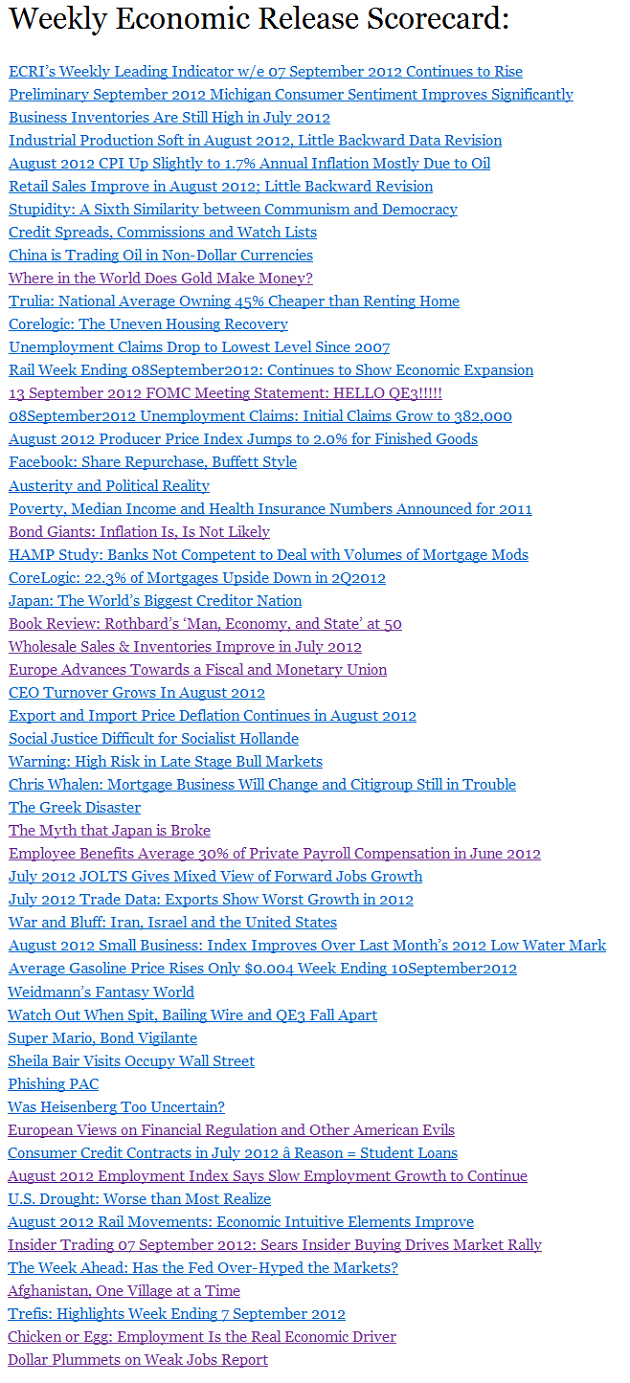
Click here to view the scorecard table below with active hyperlinks.
Bankruptcies this Week: Digital Domain Media Group
Below you may find the video.
