Key Points:
- Despite the EMA bias, the pair could be setting up for a sizable decline.
- Stochastics are heavily overbought.
- Channel structure remains in place.
The CAD/CHF could be setting up for another fairly precipitous downtrend over the coming weeks and, therefore, deserves a closer look as the week come to an end. However, before the bears grasp a firm control of the pair, it’s worth looking at the handful of technicals which will likely be keeping the bulls in play in the near term.
First and foremost, it is fairly difficult to disregard the highly bullish EMA configuration currently evident on the daily charts. When combined with the voracity of the recent surge in buying pressure and a strong bullish Parabolic SAR reading, any suggestion that the CAD/CHF is about to take a severe tumble could seem somewhat counterintuitive.
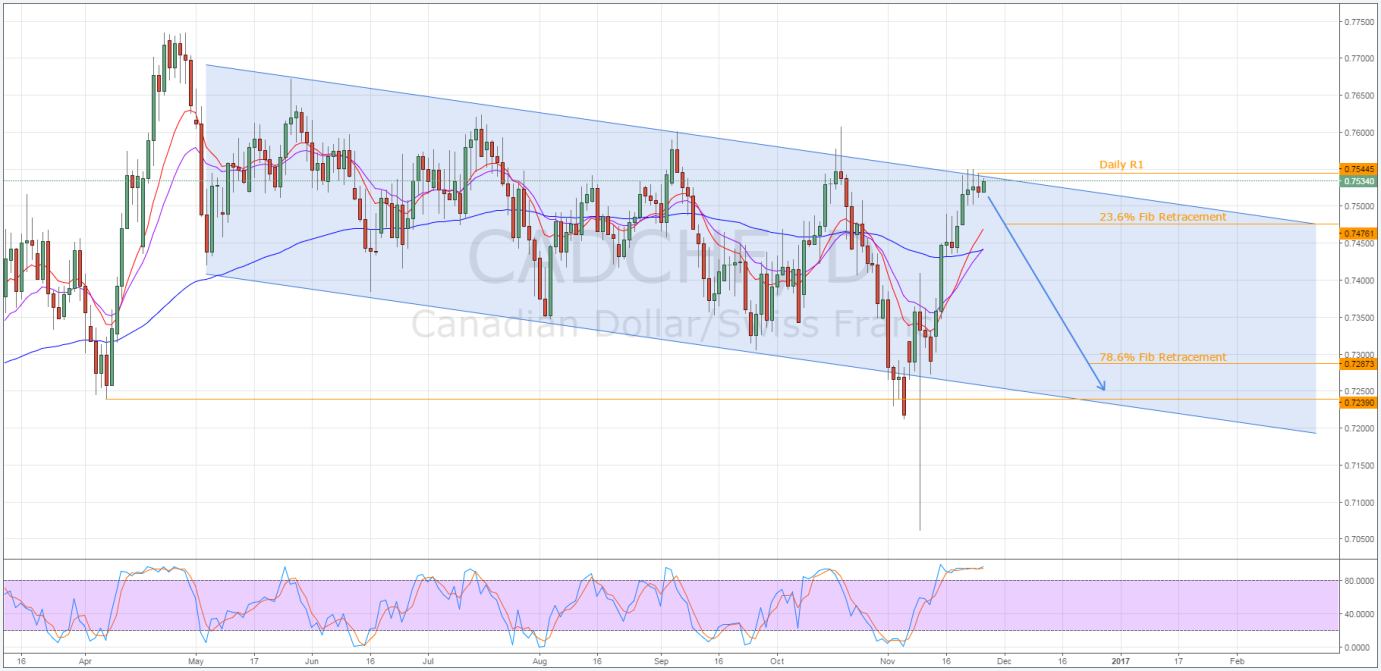
However, as fortune would have it, albeit only for the bears, there are a number of other technical forces at work which make a solid case for a reversal and subsequent downtrend. Primarily, it is the presence of the long-term channel structure that will be encouraging this shift in momentum moving forward. As is shown below, the recent spate of buying pressure has brought the pair into close proximity with the upside constraint of said channel and, if resistance holds, this could give us our point of infection.

Furthermore, looking at two other key technical readings, it looks as though this constraint will indeed hold around the 0.7544 mark. Firstly, the stochastics are deep in overbought territory and are practically screaming to be relieved by even a small slip to the downside. Additionally, resistance is being buttressed by the overlapping of the daily R1 level and the constraint of the channel.
Combined, these countervailing forces should be enough to offset the buoyancy being generated by the EMA’s and the Parabolic SAR. If this is the case and we see a decline take hold, the CAD/CHF could retrace as low as the 0.7239 mark. This point is where both a long-term zone of support and the downside constraint of the channel intersect. This being said, there are a number of supports standing between the pair and this price which will be worth monitoring as the pair descends.
The first of the zones to be wary of will be the 0.7476 level which coincides with the 23.6% Fibonacci retracement. Moreover, after retracing here, the CAD/CHF will likely be contending with the 100 day EMA which could provide some further buoyancy. However, the 100 day average has failed to generate any material dynamic support recently which will probably be the case once again.
The second zone which could halt the tumble back to the 0.7239 mark is the 78.6% Fibonacci retracement. Sitting at around the 0.7287 price level, we could see momentum pullback significantly as the pair sinks to this point which will make challenging the downside constraint somewhat less probable. Consequently, keep an eye on the ADX and other momentum indicators to gauge whether or not this is going to be the case.
Ultimately, there are a number of relatively important fundamentals on the way next week which could upset the aforementioned forecast. However, the impending Canadian GDP data is expected to come in at only 0.1%, down from 0.2% previously, which could help to add some fuel to the slide lower Regardless, Wednesday is the earliest we will see impactful economic news which could, at least, give the pair a few days for the technicals to be in play undisturbed.
