Key Points:
- Rising Wedge and ABCD pattern coming to completion
- Overbought Stochastics
- Nearing long-term zone of resistance.
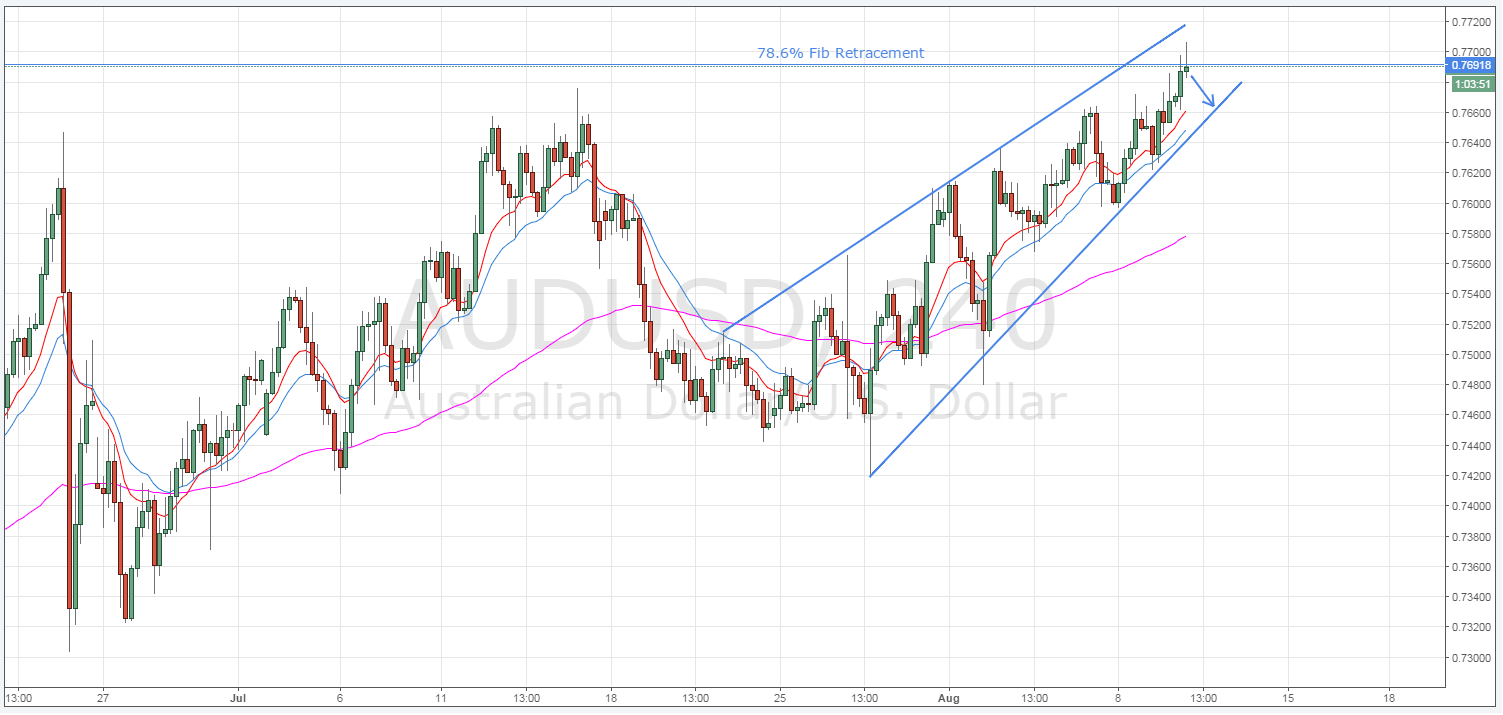
The Aussie Dollar’s bullish run may be beginning to show signs of faltering as it reaches a long term zone of resistance. Specifically, the recent appearance of not only a rising wedge but also an ABCD pattern could be heralding an imminent downturn. Likewise, the potential formation of a shooting star candle and an overbought stochastic oscillator are hinting that a tumble is looking likely for the AUD in the coming days.

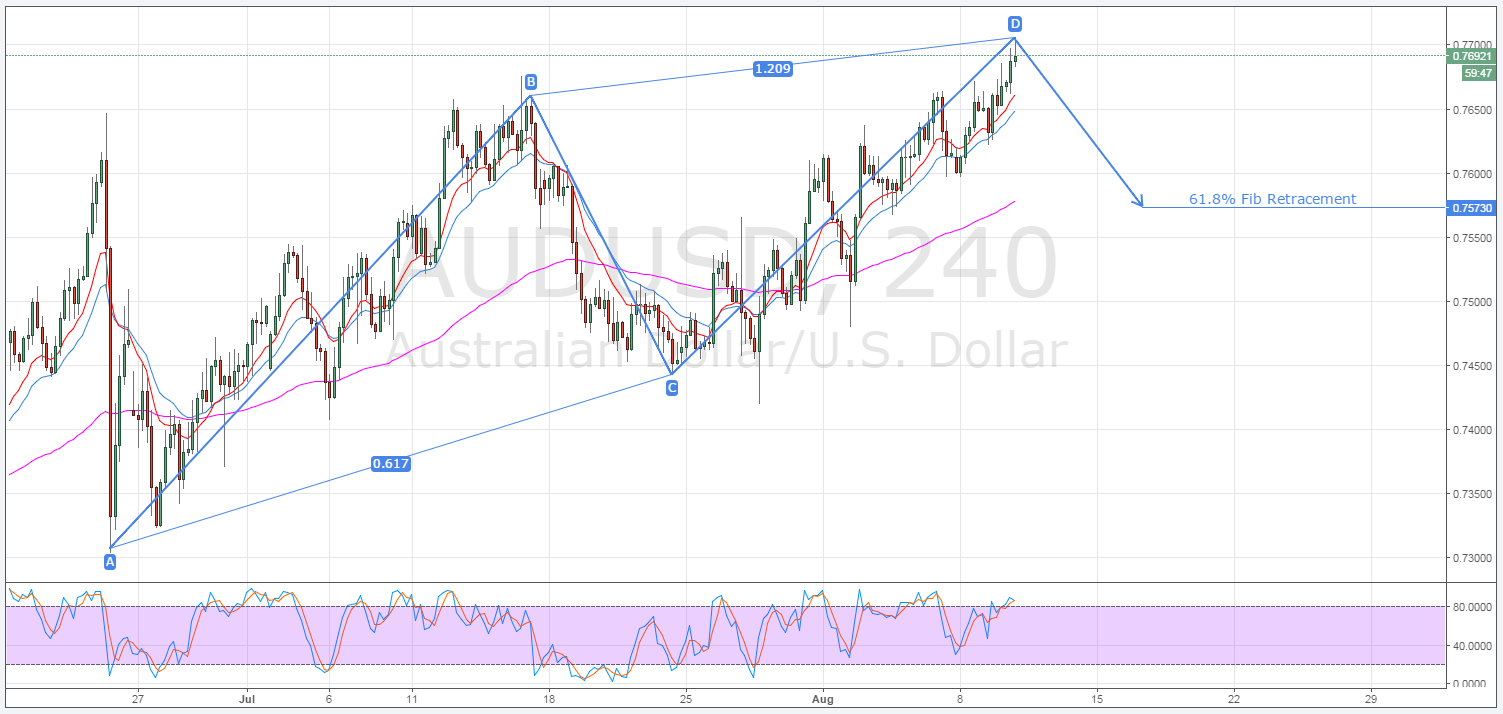
First and foremost, on the H4 chart there are two patterns which warrant a closer look. As shown above, the pair’s recent ascent has occurred in a rising wedge formation which should mean that the AUD at least moves back to support in the proceeding sessions. However, evident on the below H4 chart is an ABCD pattern which is also nearing completion. Combined, the two formations are sending a strong signal that the AUD might do more than simply move back to support. Instead of this, there could be scope for a fairly significant slip lower.

The Aussie Dollar’s current price makes sense as a turning point largely due to a long-term zone of resistance existing around the 0.7691 mark. This level represents not only a historical zone of resistance, but also the 78.6% Fibonacci retracement of the fall seen near the end of April. Additionally, the movement of the stochastic oscillator into overbought territory should see sentiment begin to swing away from the pair in the absence of some particularly weak US Jobs data. Finally, a burgeoning shooting start candle at the top of the recent rally is likewise hinting that a reversal is in the wings.
If the pair does break through the downside constraint, the next robust long-term support kicks in around the 0.7573 level. The presence of the 61.8% Fibonacci level at this price should help the pair to remain buoyant and could prove to be the point at which the AUD moves to climb higher once more. However, keep a close watch on the daily parabolic SAR readings around this level as they could give an insight into just how low the pair can travel.
Ultimately, it remains unlikely that any downturn in the next few days will see the Aussie Dollar back below the 0.75 handle. This being said, the pair’s much needed cooling off could still present some opportunity for the perpetual bears out there. However, keep a close eye on the JOLTS Job Openings data as it is likely to generate a significant amount of sentiment which could derail the technical setup discussed above.
