It has been a painful start to the summer for gold traders and investors, particularly for yours truly. Though we anticipated the correction that began back in April, we never fully expected it to extend for as long and as deep as it has run. However, this post from mid-May clearly lays out that $1235 COMEX gold was at least a "possibility."
So now here we are. It's July, and COMEX gold continues to flounder with seemingly no end in sight. Or maybe that's not the case.
As we type on Tuesday morning, the price of gold has rebounded overnight on dollar weakness and news that the PBOC has stepped in to aggressively defend the yuan and stop its freefall. My colleague here at Sprott Money, David Brady, wrote an excellent article last week explaining a possible link between the USD/CNY and COMEX gold. If you missed it, you should read it now:
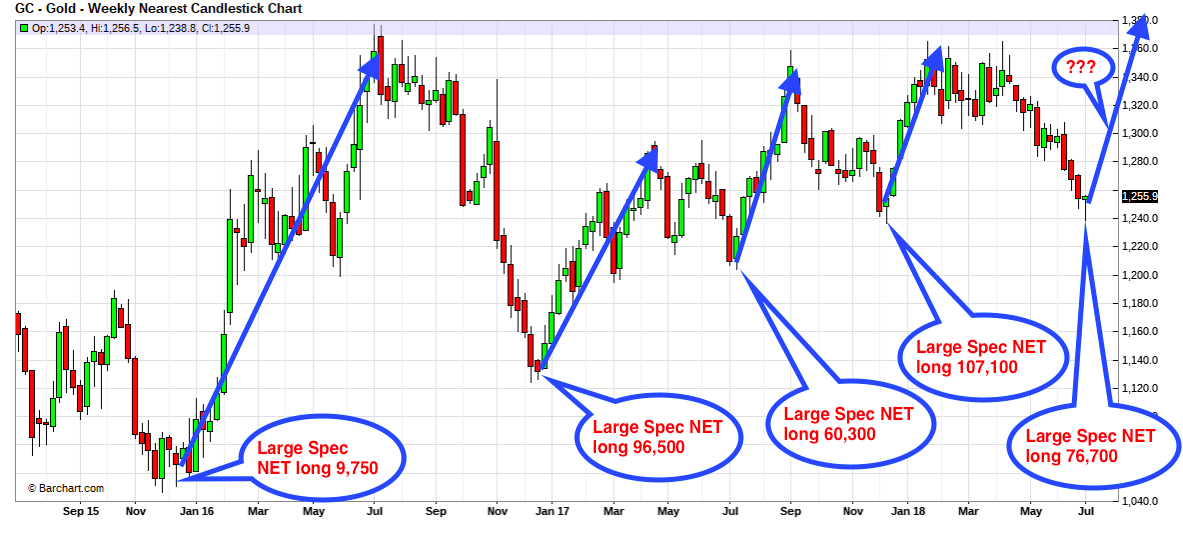
Whether or not the extended drop and today's rally are directly linked to the yuan remains to be seen. What we do know, however, is that COMEX gold is tremendously "oversold" and due for a rally. Additionally, the charts and Commitment of Traders structure look decidedly similar to this time last year—a period that was followed by a $150 rally in COMEX gold between July 7 and September 7. Might we see a similar rally play out in the summer of 2018?
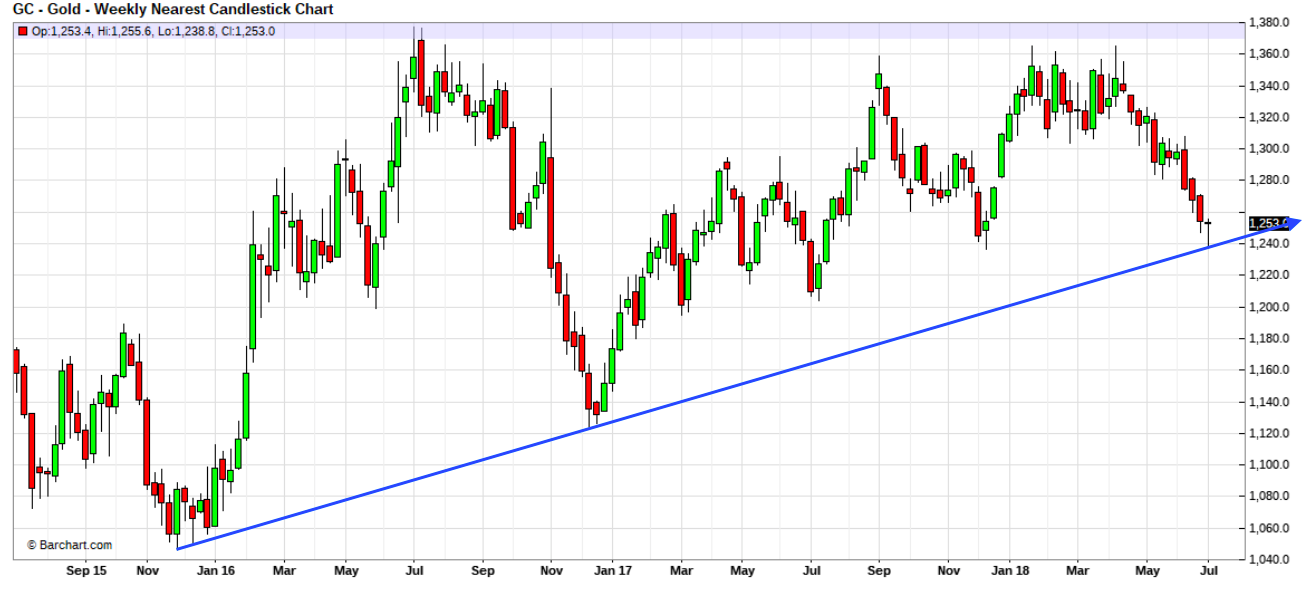
Well, first let's check the long-term weekly chart. Why in May did we suggest $1235 as a possible low? Because that level would mark the extension of the primary, long-term trend line that be gins at the bear market lows of December 2015 and extends through the lows of December 2016. An updated chart is posted below, and you should be sure to note that the selling on Monday of this week eased precisely at this line. Additionally, if the weekly candle turns green by the close this Friday, it will likely mark a key reversal. Thus the level to watch through this week is $1255.

Next, let's check the Commitment of Traders positioning. As mentioned above, the current structure is at its most "bullish" since the report surveyed July 11, 2017. Back then, the Large Specs in gold were NET long just 60,260 contracts, while the "Commercials" were NET short 73,900. As of last Tuesday, June 26, 2018, the Large Specs were NET long just 76,700 contracts, while the "Commercials" were NET short 94,900. An updated report for the survey taken later today (July 3) will be available next Monday, the 9th.

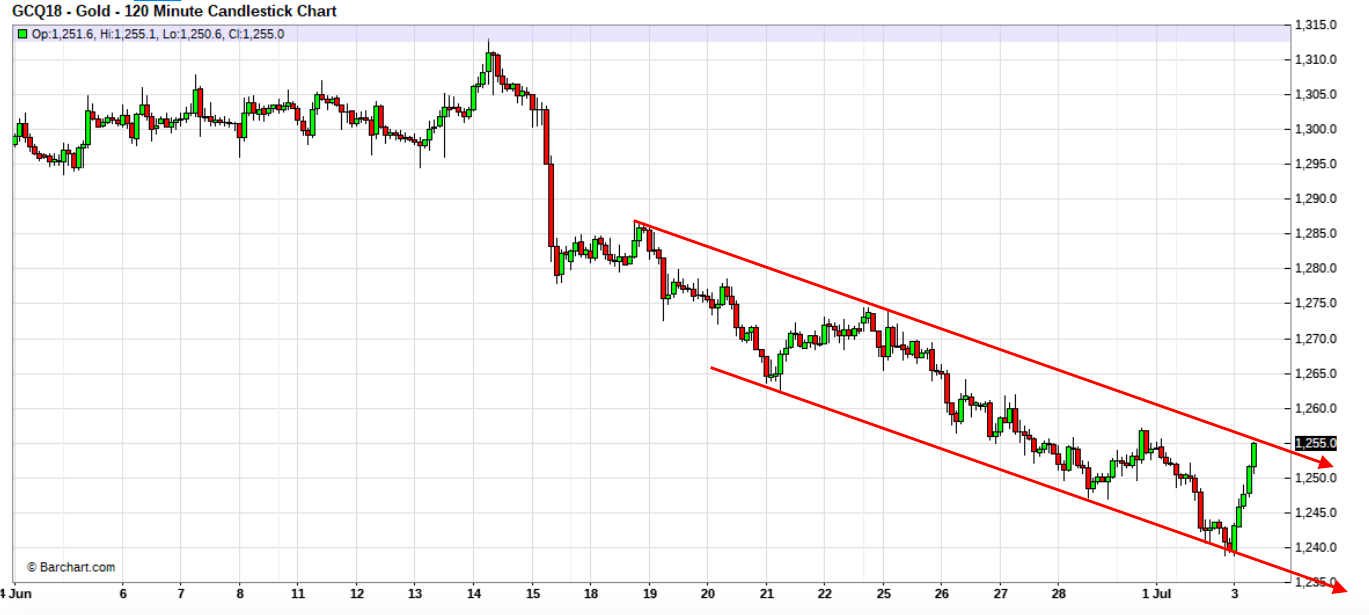
But finally, and most importantly, let's check the short-term chart. Though price has rallied, it has not yet clearly broken out of the well-defined downtrend channel that has contained it for nearly three weeks. Trying to catch a falling knife can cause a lot of pain, so we're not going to get too excited until and unless we see price finally break out of the channel shown below. Once this happens, we can finally begin to envision our long-awaited summer rally.

In summary, this latest downturn in COMEX gold was not unexpected. What was mostly unexpected was the severity of the decline. However, all selloffs and rallies eventually come to an end, and this current trend will soon reverse, too. Once it does, COMEX gold is positioned for the summer rally that we've projected since late last year. This rally should take price to and through the old resistance near $1360, extending all the way to $1395 before it fades and consolidates. This would be consistent with what we saw in COMEX gold during the summer of 2017, and we can now expect the same type of performance in the summer of 2018.
