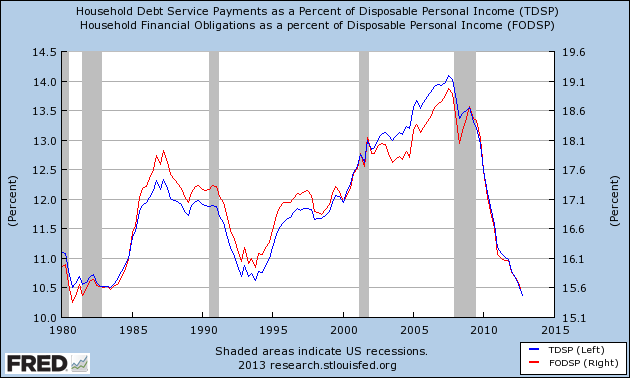
I was intrigued by a graphic in a post on The Big Picture blog, and the question which accompanied this graphic:
Is the era of consumer deleveraging, which began just prior to the start of the recession, at an end?
A inherent problem with this chart is that if one lowers interest rates (aka ZIRP et al), the cost of loan payments decline – and it has nothing to do with deleveraging. But this does not negate the question, or the relevance of the chart to consumer debt.
Another part of the problem in the world where data seems to be omnipresent – is that some of the vital pieces to perform a detailed analysis are missing. There are even questions on this TDSP data series from the Federal Reserve (which is the basis of the above graph).
The limitations of current sources of data make the calculation of the ratio especially difficult. The ideal data set for such a calculation would have the required payments on every loan held by every household in the United States. Such a data set is not available, and thus the calculated series is only a rough approximation of the current debt service ratio faced by households.
Whether the consumer deleveraging cycle is over is something I continue to ponder, and a good answer alludes me.
- One of the constraints in answering is that consumer deleveraging implies selling of assets to pay off debt or default. As the painful process ends, deleveraging implies that a consumer would be in a relatively better position to begin buying on credit again – and in turn contribute to expanding the economy.
- To answer this question one needs median consumer data in real time which does not exist. No data exists to isolate the 99%.
- There is not even a data series in cyberspace I can find on the number of mortgages outstanding on owner occupied residences.
- If you sell a house with a mortgage, is that deleveraging? Technically yes, if the purpose was to get out of a loan which was more than the value of the house, or if one sells a house to pay off a debt. But in the case of home ownership, the cash flow for repayment of the debt is simply replaced by payment for rent. Housing is an expense which occurs whether it is a mortgage interest expense or rent expense. Getting out from under a mortgage on average may not improve the consumer’s ability to consume. Home ownership has declined 4% since the beginning of the collapse of the housing bubble. Is this home ownership trend ending? – I do not think so.
- By far, mortgages are the biggest component of consumer debt, and therefore the dynamics of home ownership rates would have a big impact on consumer debt.

As stated earlier, median data does not exist for consumer credit in real time. All an analyst can do is use data totals and suggest what answer is to the average consumer. Even on a per capita basis (which includes the 0.1%), there is no proof the consumer deleveraging cycle has ended.

But because of the unique situation with mortgages being included in the above graphic, when one only looks at revolving (credit cards) and non-revolving credit (automobile loans, student loans)- it is clear the consumer debt trough has passed. [Note: even removing student loans from the chart below - does not change the fact that consumer debt per capita is growing.]

Is the consumer deleveraging over? It depends on how you look at it.
Other Economic News this Week:
The Econintersect economic forecast for June 2012 again declined marginally, and remains under a zone which would indicate the economy is about to grow normally. The concern is that consumers are spending a historically high amount of their income.
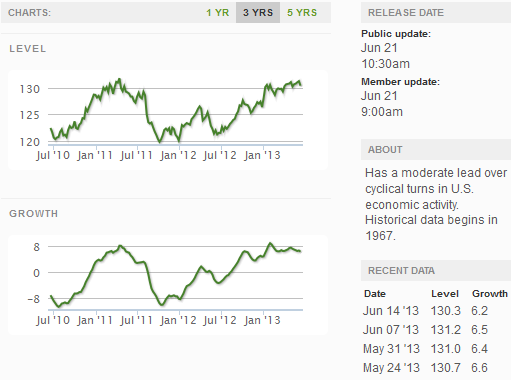
The ECRI WLI growth index value has been weakly in positive territory for over four months – but in a noticeable improvement trend. The index is indicating the economy six month from today will be slightly better than it is today.
Current ECRI WLI Growth Index

Initial unemployment claims degraded from 334,000 (reported last week) to 354,000 this week. Historically, claims exceeding 400,000 per week usually occur when employment gains are less than the workforce growth, resulting in an increasing unemployment rate.
The real gauge – the 4 week moving average – worsened from 345,250 (reported last week) to 348,250. Because of the noise (week-to-week movements from abnormal events AND the backward revisions to previous weeks releases), the 4-week average remains the reliable gauge.
Weekly Initial Unemployment Claims – 4 Week Average – Seasonally Adjusted – 2011 (red line), 2012 (green line), 2013 (blue line)

Bankruptcies this Week: Orchard Supply Hardware Stores, OnCure Holdings
Data released this week which contained economically intuitive components(forward looking) were:
- Rail movements are beginning to show a modest growth trend.
- The FOMC meeting statement although not a proven indicator – did not change ZIRP or QE (ending one or both would be an economic drag). However, the market did react to the new perception that the Fed was going to start tapering off asset purchases (confusing because this schedule was mentioned before)
Weekly Economic Release Scorecard:
Click here to view the scorecard table below with active hyperlinks

