👀 Ones to watch: The MOST undervalued stocks to buy right nowSee Undervalued Stocks

Is Gold’s Breakout Sustainable?

Published 09/05/2017, 01:10 AM
XAU/USD
-0.52%
DX
-0.09%
GC
-1.69%

Key Points:

  • Price action rallies as geopolitical risk in North Korea increases
  • RSI Oscillator strongly overbought
  • Watch for a period of moderation before the rally recommences

The past few weeks have proved to be a relatively large boon for gold markets as increased geopolitical risk, as well as slipping U.S. centric economic data, has seen the precious metal assail the $1300 handle to trade around the present $1336 an ounce mark. However, the question remains as to whether the current valuation will hold in the coming weeks given that the oscillators are currently strongly overbought.

In particular, the RSI Oscillator is presently providing some cause for concern given that the metric is indicating relatively strong overbought levels. Additionally, price action is now nearing a key swing point from last year’s gold flash crash around the $1337.34 mark. This was a key level back in November 2016 and should prove to be relatively interesting in the days ahead.
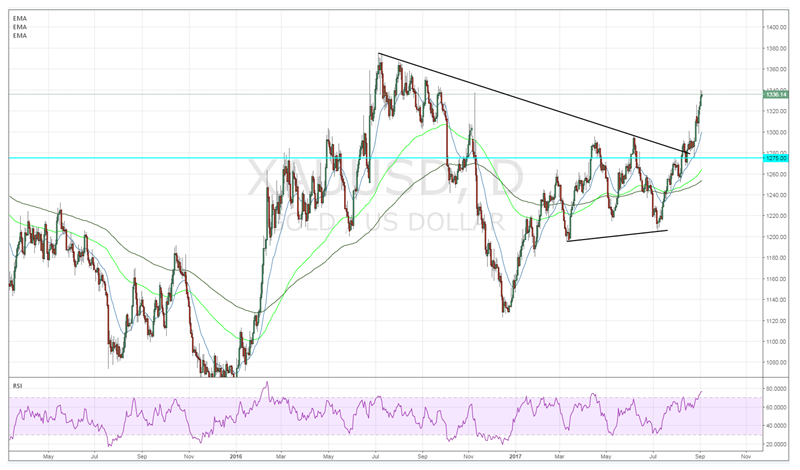
XAU/USD Daily Chart

Much of the rapid upward momentum in gold prices has been largely to do with rising geopolitical risk in North Korea. Presently, there appears to be no end in sight with the potential for armed confrontation growing as neither Trump nor Kim Jong Un appear willing or able to back away from the precipice. Subsequently, this situational conundrum bodes well for the precious metal which is typically seen as a safe haven especially when the risk of flying missiles is on the increase.

In addition, the metal has been buoyed by successive rounds of disappointing data emanating from the U.S. and a central bank that appears schizophrenic in their approach to monetary policy. In fact, a range of misses within labour market and slipping GDP estimates have proved highly bullish for the metal over the past few weeks. This has led to a significant pullback in the U.S. Dollar Index and the valuation of the greenback.

3rd party Ad. Not an offer or recommendation by Investing.com. See disclosure here or remove ads.

Ultimately, the technical perspective argues for a short term pullback or period of moderation given the highly overbought oscillator levels. However, fundamentals are largely driving the metal's current trend and these factors remain highly biased to the upside. Subsequently, the most likely scenario is one where gold turns sideways for a period of moderation before recommencing its run higher. The reality is that gold prices have turned the corner and that the time for a recoupling between prices and the M2 figures is long overdue.

Which stock should you buy in your very next trade?

AI computing powers are changing the stock market. Investing.com's ProPicks AI includes 6 winning stock portfolios chosen by our advanced AI. In 2024 alone, ProPicks AI identified 2 stocks that surged over 150%, 4 additional stocks that leaped over 30%, and 3 more that climbed over 25%. Which stock will be the next to soar?

Unlock ProPicks AI

Latest comments

Loading next article…
Risk Disclosure: Trading in financial instruments and/or cryptocurrencies involves high risks including the risk of losing some, or all, of your investment amount, and may not be suitable for all investors. Prices of cryptocurrencies are extremely volatile and may be affected by external factors such as financial, regulatory or political events. Trading on margin increases the financial risks.
Before deciding to trade in financial instrument or cryptocurrencies you should be fully informed of the risks and costs associated with trading the financial markets, carefully consider your investment objectives, level of experience, and risk appetite, and seek professional advice where needed.
Fusion Media would like to remind you that the data contained in this website is not necessarily real-time nor accurate. The data and prices on the website are not necessarily provided by any market or exchange, but may be provided by market makers, and so prices may not be accurate and may differ from the actual price at any given market, meaning prices are indicative and not appropriate for trading purposes. Fusion Media and any provider of the data contained in this website will not accept liability for any loss or damage as a result of your trading, or your reliance on the information contained within this website.
It is prohibited to use, store, reproduce, display, modify, transmit or distribute the data contained in this website without the explicit prior written permission of Fusion Media and/or the data provider. All intellectual property rights are reserved by the providers and/or the exchange providing the data contained in this website.
Fusion Media may be compensated by the advertisers that appear on the website, based on your interaction with the advertisements or advertisers.
© 2007-2024 - Fusion Media Limited. All Rights Reserved.