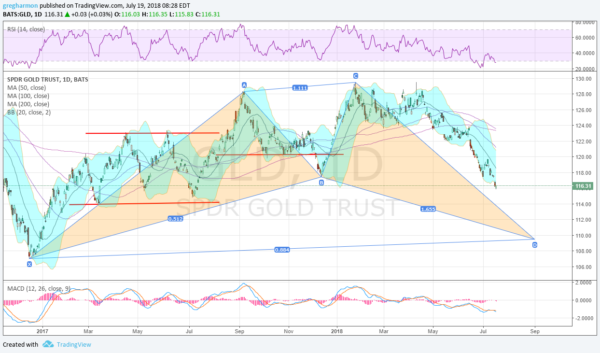
Gold has had a rough 2018. Oh, it started out looking good. A move from a December low to a high in January had added over 10$=% to the price per ounce. But then it stalled there. Not an issue at first as consolidation after a move like that is normal, almost expected. And the Consolidation continued into April. But Gold prices did not break the consolidation the way that bulls wanted.
Gold broke to the downside toward the end of April, as shown in the Gold ETF (NYSE:GLD), below. It found support at the 200 day SMA at first at the end of the month. A bounce from there made it back to the 100 day SMA before reversing lower. This time it fell through the 200 day SMA, a bearish signal for many. it consolidated there for 3 weeks and then started on the current path lower.
Earlier this week Gold fell below the December low, making a new 52 week low. And it has kept going. With that break it establishes a bullish Shark harmonic pattern. Yes, I wrote bullish, but the bull part does not come into play until after it retraces 88.6% or 113% of the the move marked X-A in the chart. That means a target of 109.50 or 104.25, more pain. This can be traded to that target against the gap down this week as a stop loss.
The information in this blog post represents my own opinions and does not contain a recommendation for any particular security or investment. I or my affiliates may hold positions or other interests in securities mentioned in the Blog, please see my Disclaimer page for my full disclaimer.

