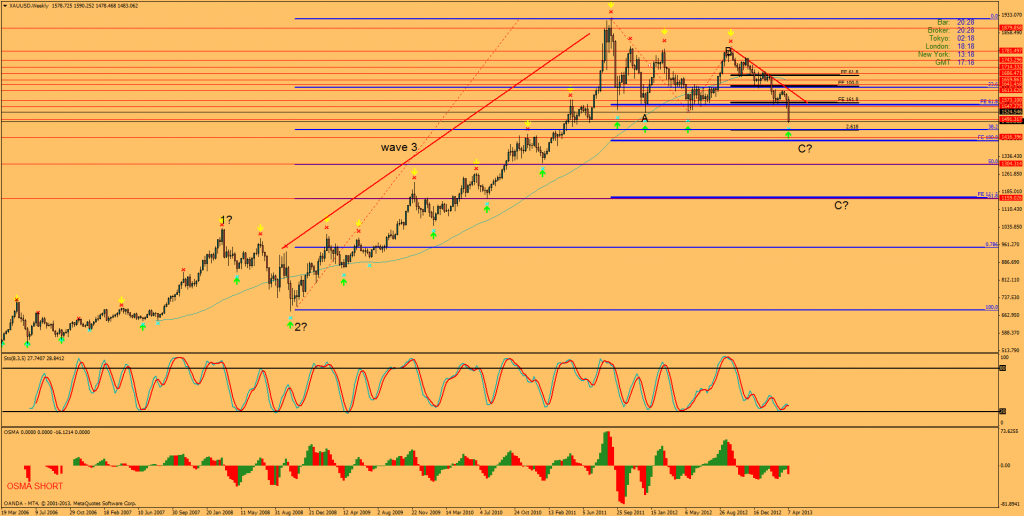
Back at the break of gold's highs, when all the mass media started to preach about gold being dead in a dead market while producing multiple death crosses stories, I posted a chart and article where I stated my view of what will happen with gold. Lets see, if my prediction will become true:
This was the chart I posted back then, dated 07.04.13
Now let's check out some new, fresh charts:
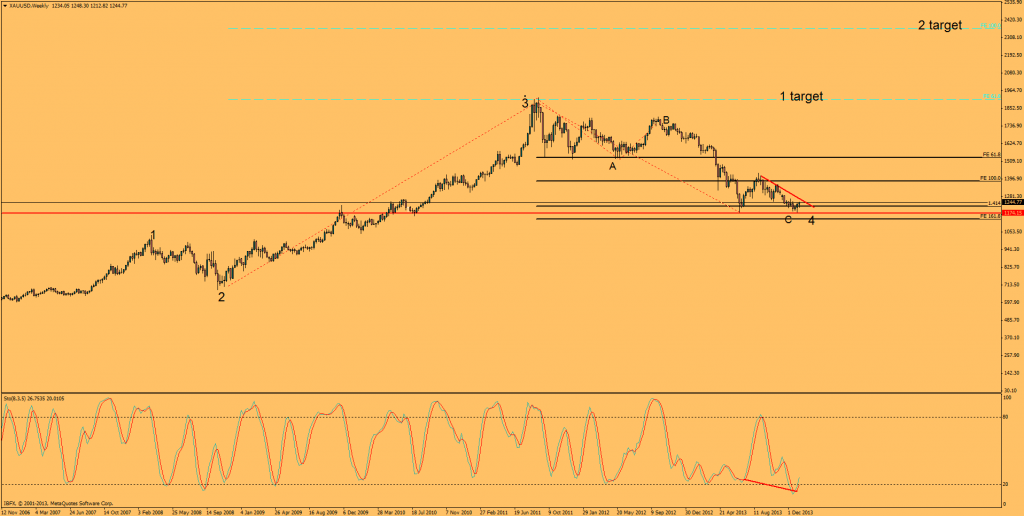
As pointed out in my first chart, we are in the process of making a 4th wave ABC pattern. Hopefully, the final leg stopped at the 1.414 extension.
Now, we are ready for the final move. Still there is a trend line that has to be broken to confirm the bottom. If that bottom will hold, the future will show.
Finally, and maybe most important, stochastics are showing a hidden divergence!
Now, my favorite part, profit targets:
For Fib. fans, lets talk about ratios:
Target #1: The the highs of 1900sh (depending on your broker). If gold will stall there, then reverses, we will have a double top.
Target #2: 2363 which is 100% of the length of the 3rd wave, which will then also have formed an ABCD pattern.
I can't give further price targets for the simple reason that the chart does not allow for it.
As I read it however, very often—especially with gold—the 5th wave is over-extended and tends to be longer than the 3rd wave:
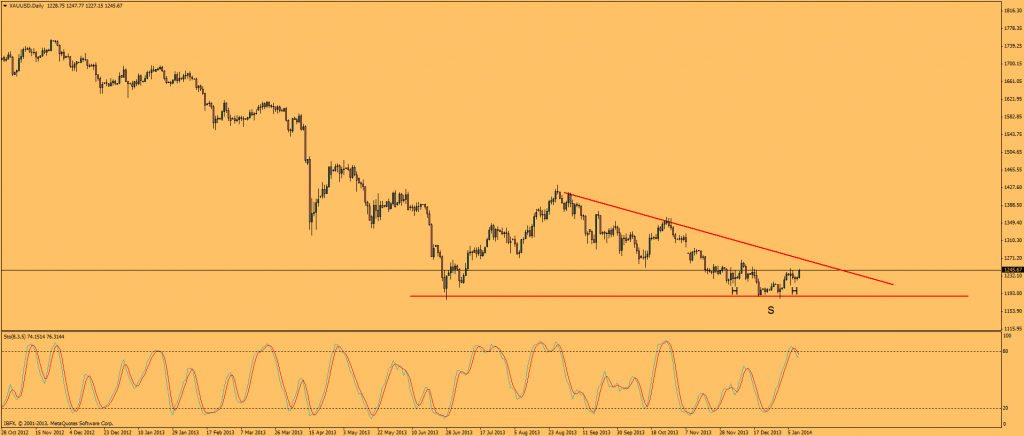
Here's a D1 chart with inverse H&S pattern.
Original post
